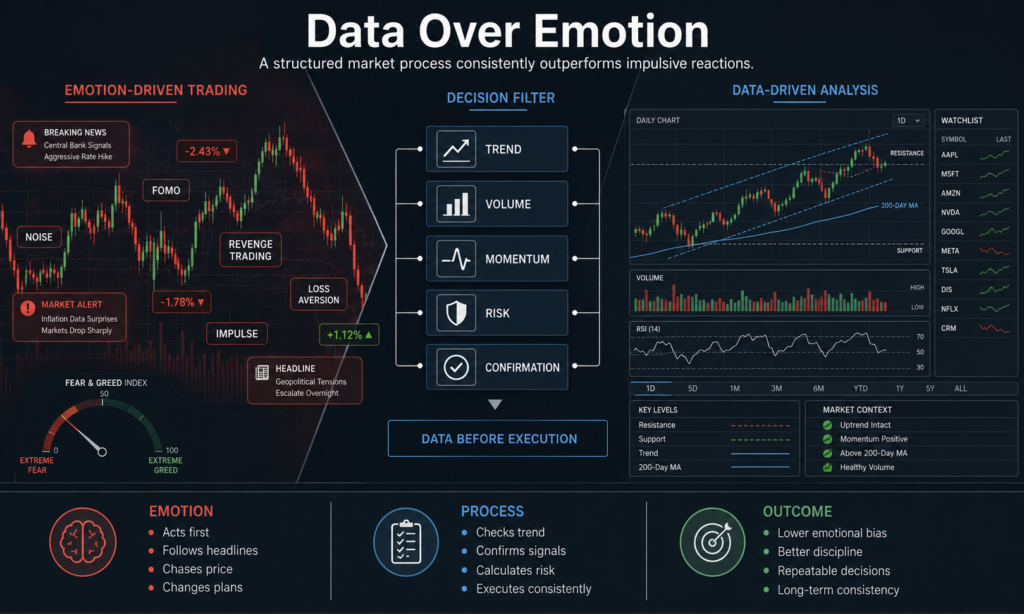
Having a screen packed with market data is completely useless if your execution still gets hijacked by last-minute panic. Consistent results don’t come from predicting the future; they come from having a reliable filter to separate high-probability setups from daily market noise. Professional analysts and long-term survivors survive because they rely on structured analysis methods to carefully gather data on historical and current price movements. Once your execution model is anchored entirely in objective market data, you effectively strip the power away from unstable trading psychology. This structured approach leaves zero room for the common emotional biases—such as late entries triggered by FOMO (Fear of Missing Out), account-destroying revenge trading, or the wealth-killing hesitation of loss aversion—to interfere with your plan.
Chasing quick gains on pure instinct is a fast track to drawdown; instead, understanding how to read market trends shifts your focus to high-probability setups backed by professional risk management.
The Core Mechanics of Data-Driven Trading
Understanding Price Data and Market Dynamics
A chart isn’t just lines and bars; it is a live record of a massive tug-of-war between buyers and sellers reacting to shifting market expectations. Every single tick updates this continuous history in real time, capturing how retail accounts and institutional desks digest major macroeconomic news, surprise central bank rate hikes, and incoming data points. To navigate this landscape without emotional interference, it helps to analyze price action alongside market sentiment instead of relying on personal validation or intuition.
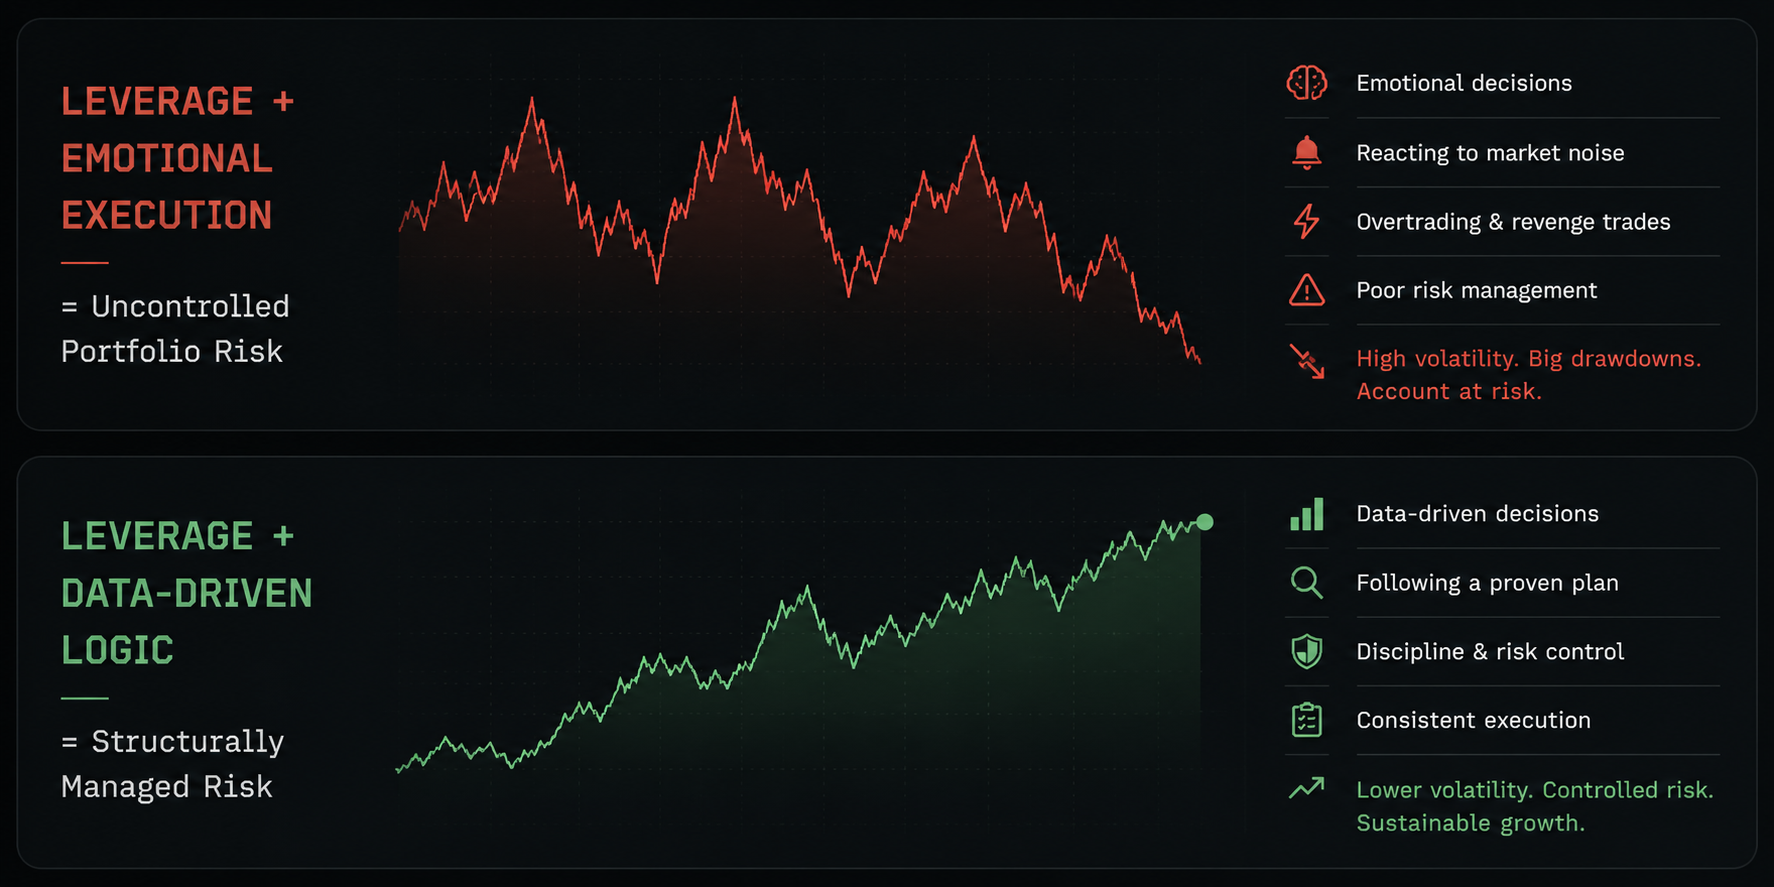
Maintaining a cold, objective mindset is absolutely non-negotiable for capital preservation when navigating high-stakes environments like CFD trading. Successful market veterans know that longevity comes from examining historical price structures to find repeatable tendencies, rather than trying to accurately predict market tops and bottoms. Remember, leverage aggressively multiplies both your potential profit (economics) and your losses—meaning a minor spike in market volatility can wipe out an entire account in minutes if you trade without a strict plan.
Analytical Automation: How AI Can Assist in Market Trend Analysis
Modern financial data infrastructure lets automated tools process massive amounts of market noise quickly. Financial institutions increasingly rely on automated tools to process large volumes of market data, while organizations such as the CFA Institute continue to emphasize that human judgment remains essential when interpreting analytical output.
Machine learning algorithms excel at heavy lifting—they process substantially larger datasets than any human counterpart and efficiently isolate statistical relationships that warrant further study. Even so, automated patterns are only half the battle. Sound trading still hinges on rigorous human oversight at the execution level, as historical correlations frequently break down when faced with new market realities.
Market Trend Analysis: Technical Tools and Frameworks
Structuring Market States: What Are the Different Types of Market Trends?
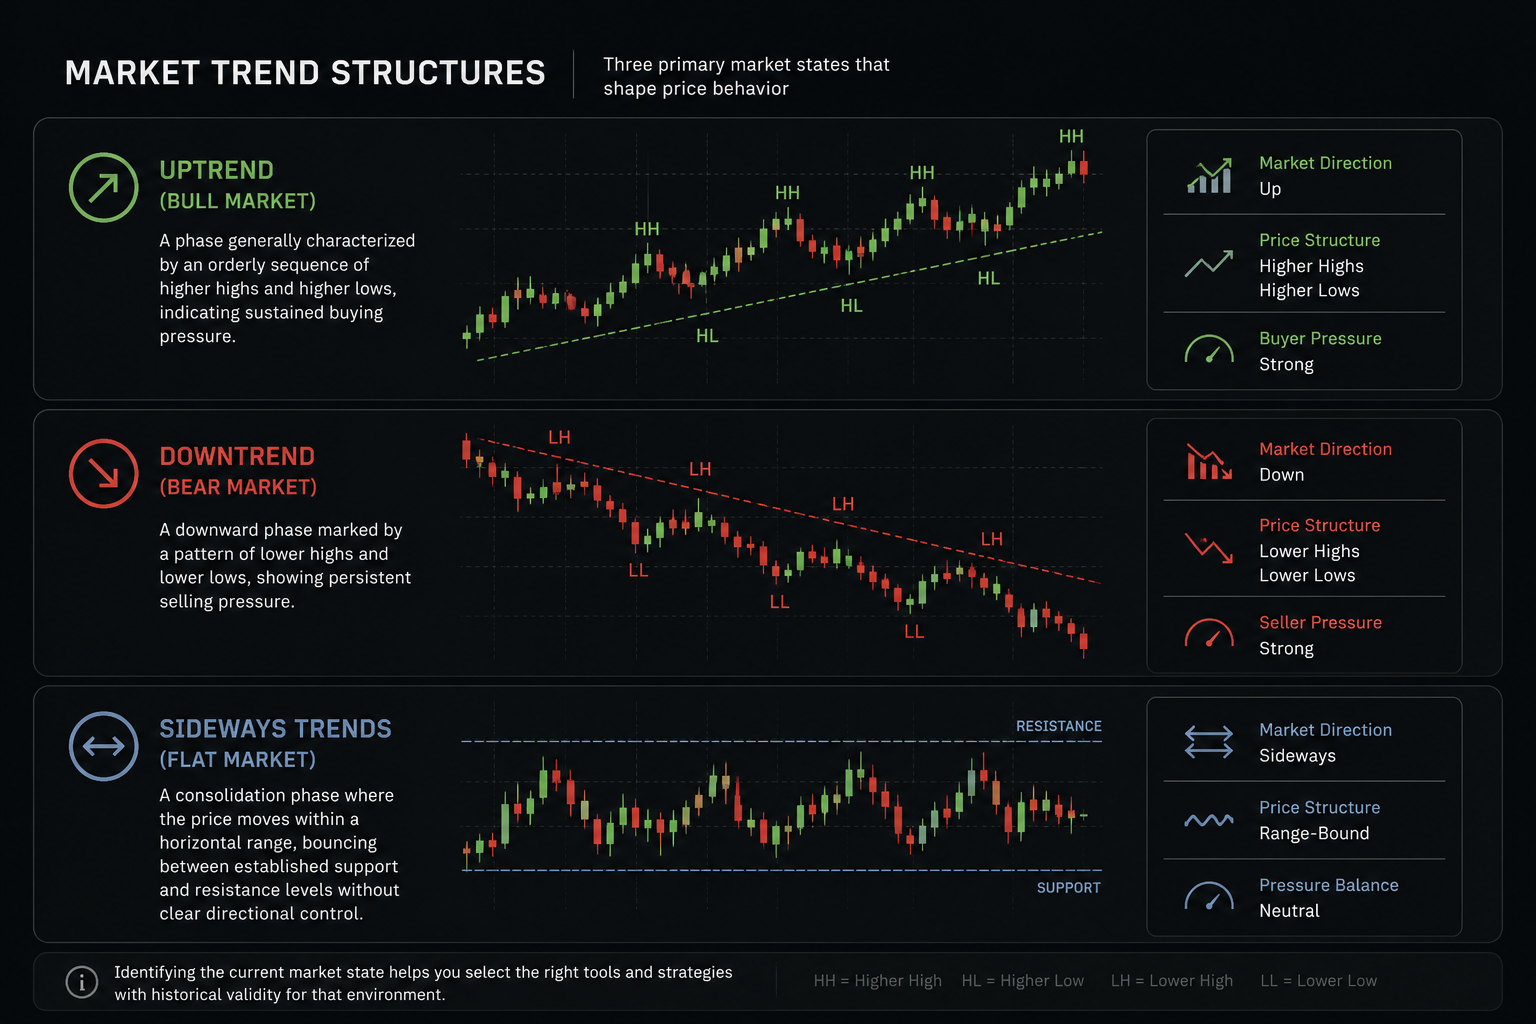
To read market context accurately, technical analysts break down asset price action into three fundamental directions. Identifying the current market state helps you select which tools have historical validity for that environment.
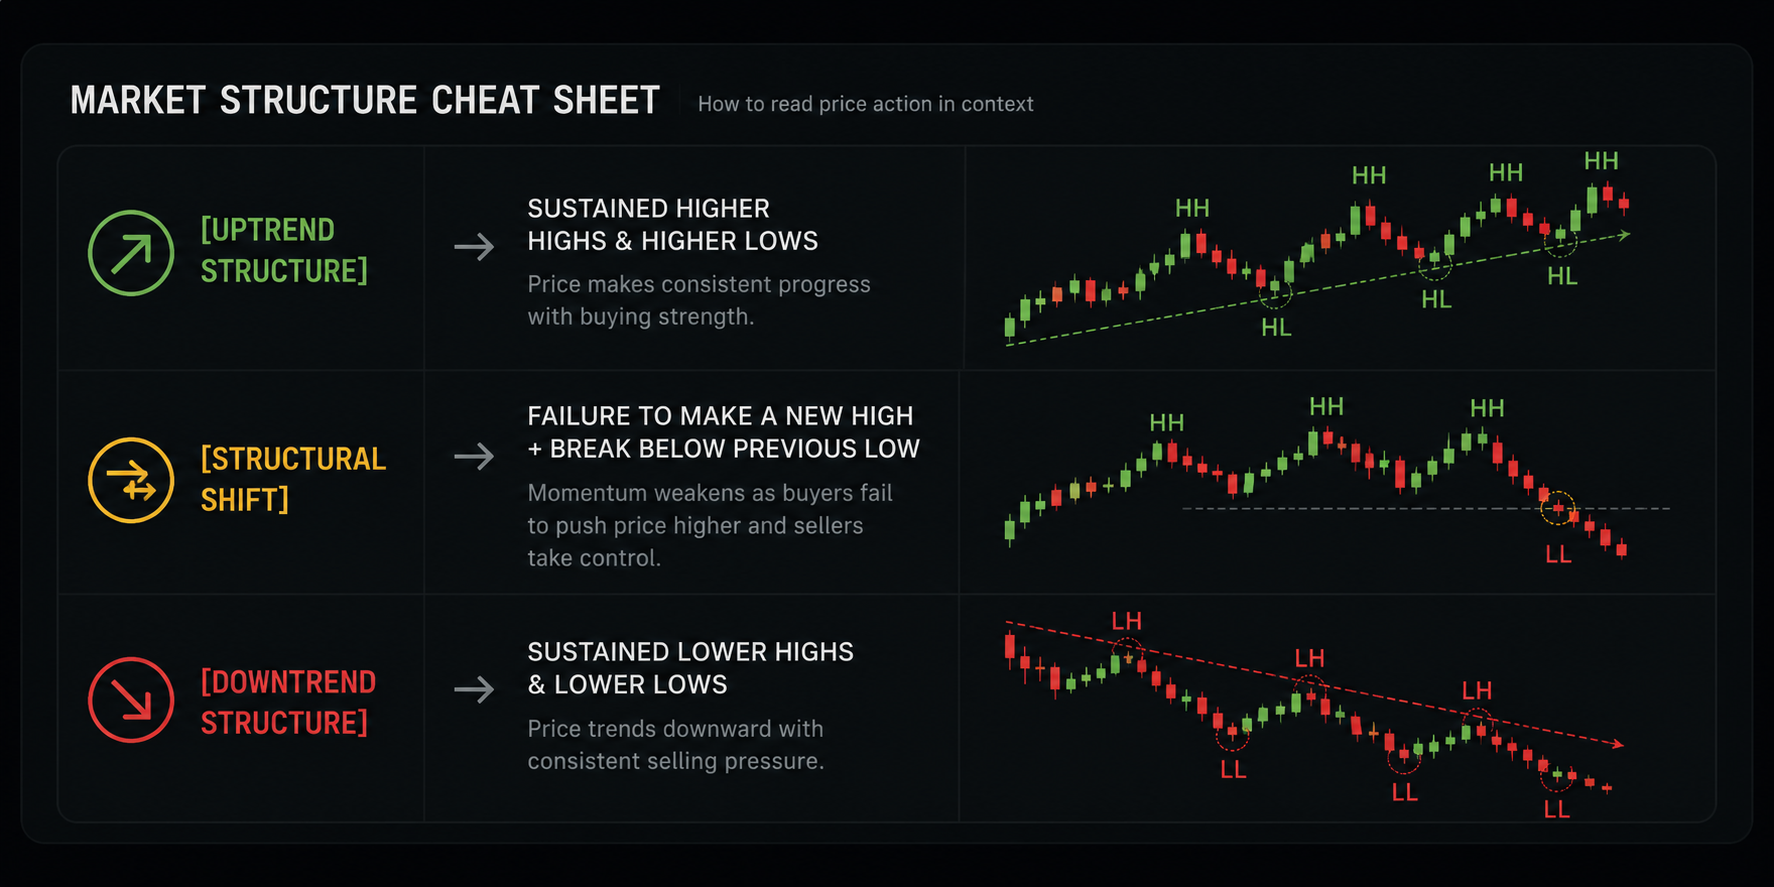
- Uptrend (Bull Market): A clear upward phase where the tape shows persistent buying conviction. Visually, you will see an orderly pattern of higher highs and higher lows protecting the macro direction.
- Downtrend (Bear Market): A markdown phase dominated by aggressive supply. Every attempt to bounce stalls early, leaving a trail of lower highs that signals institutions are unloading positions.
- Sideways Trends (Flat Market): A directionless consolidation environment. Instead of trending, the asset chops horizontally, repeatedly testing visual support and resistance levels until a fresh catalyst forces a breakout.
Multi-Timeframe Frameworks: How Often Should Market Trends Be Analyzed?
Analysis frequency depends entirely on your strategy. A long-term investor needs nothing more than a weekly check on daily charts to track structural capital shifts. But if you are a short-term stock trader, your focus shifts to fast-moving intraday windows like the 1-hour or 15-minute intervals during high-volume sessions. You want to execute when the market is moving—which is why equity traders camp out at the New York open, while FX traders wait for the London overlap.
Quantifying Market Momentum with Technical Indicators
Technical analysis focuses on interpreting historical price and volume data to identify recurring behavior and potential trend changes. Rather than guessing when a market is turning, you can use mathematical formulas to build trading signals.
To organize this data efficiently, using an advanced charting ecosystem like MetaTrader 5 allows you to view multiple technical market indicators like moving averages across different timeframes simultaneously. This setup can help take the emotion out of routine analysis by turning market observations into clear visual indicators.
What Tools and Indicators Are Used to Identify Market Trends?
Most market operators don’t jump straight into chaotic raw charts; they start by filtering out daily noise using moving averages to establish a clean baseline. By averaging out closing values over specific historical windows, these indicators smooth out erratic short-term price fluctuations and bring the core trend direction into sharp focus long before you look for final confirmation signals.
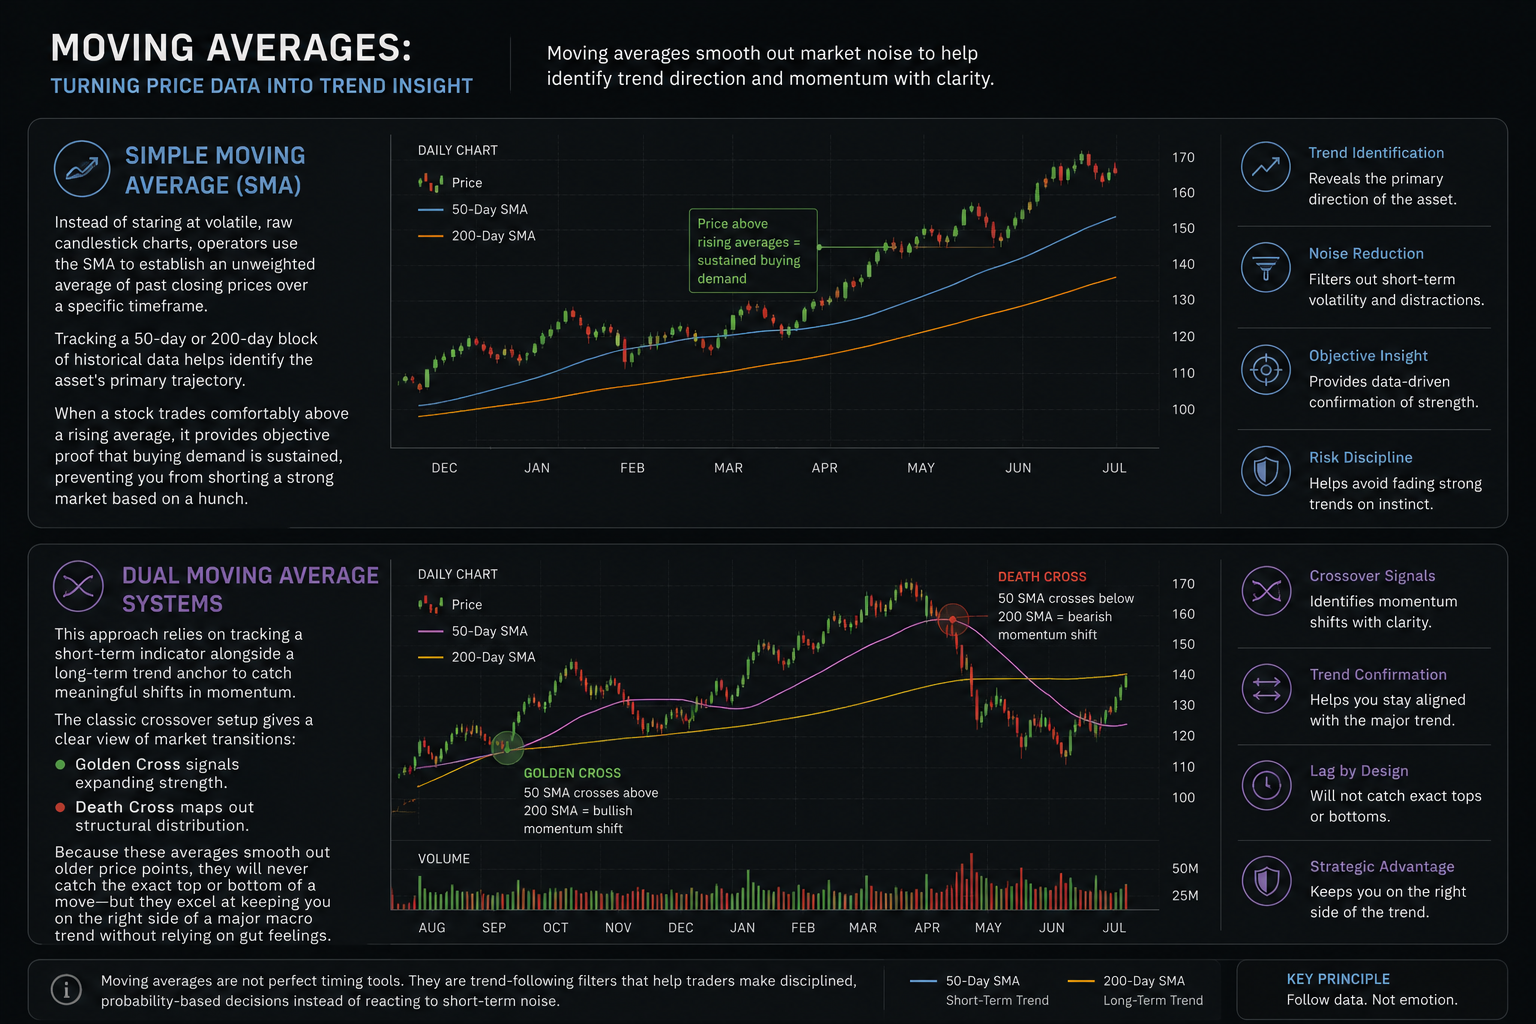
- Simple Moving Average (SMA): Instead of staring at volatile, raw candlestick charts, operators use the SMA to establish an unweighted average of past closing prices over a specific timeframe. Tracking a 50-day or 200-day block of historical data helps identify the asset’s primary trajectory. When a stock trades comfortably above a rising average, it provides objective proof that buying demand is sustained, preventing you from shorting a strong market based on a hunch.
- Dual Moving Average Systems: This approach relies on tracking a short-term indicator alongside a long-term trend anchor to catch meaningful shifts in momentum. The classic crossover setup gives a clear view of market transitions; a “Golden Cross” signals expanding strength, while a “Death Cross” maps out structural distribution. Because these averages smooth out older price points, they will never catch the exact top or bottom of a move—but they excel at keeping you on the right side of a major macro trend without relying on gut feelings.
Tracking Relative Strength and Reversals with Momentum Oscillators
Finding a trend is great, but you also need to know if that trend is about to hit a brick wall. That is where the relative strength index (RSI) comes in, measuring the pure acceleration behind recent stock price movements. The classic setup looks at thresholds: anything above 70 implies the market is overbought, while drops under 30 suggest an oversold state. The big catch is that in a highly directional environment, these math models lose their predictive edge and can stick to the extremes while late shorts get squeezed out.
To find a setup you can actually replicate, you want to spot a clear momentum divergence. If you look at major market tops, they rarely happen out of nowhere; instead, the price prints a final, exhausting high while the RSI prints a lower high, providing an objective mathematical hint that the macro trend is losing its grip.
Data Visualization: Reading Chart Patterns and Price Action to Detect Trends
While mathematical indicators provide clean data, visual chart layouts help you map out key structural areas quickly. In technical analysis, chart patterns represent historical areas where buyers and sellers have repeatedly interacted.
Visualizing Structural Changes in Price Action
One of the core ideas behind chart analysis is that trends become easier to recognize when swing highs and lows begin following a consistent pattern. A shift in trend is often confirmed when an asset fails to maintain its current sequence of highs or lows.
To see how this data operates in a live environment, we can look back at the daily chart of NVIDIA (NVDA) from the opening months of last year.
Throughout that first quarter, the equity advanced within an incredibly orderly trend, establishing a textbook structural staircase of higher highs and clean, protected higher lows. However, this apparent strength masked an underlying shift in volume velocity. By April 2025, a distinct bearish divergence began printing under the surface: while the spot stock price managed to squeeze out one final macro peak, the oscillator rolled over completely, failing to confirm the move. This early warning printed well before the physical trend reversal showed up on the candles, proving that velocity often dries up long before big blocks stop clearing. Within days, the asset aggressively cracked its previous swing low, validating the structural shift first signaled by the momentum divergence.
A Structured Framework for Trading Without Emotions
Implementing a Step-by-Step Decision Workflow
To keep emotions entirely out of the equation, systematic operators run through a strict, multi-step checklist to filter setups before risking a single dollar. While this routine is not a magic formula for guaranteed winners, it acts as a critical firewall, weeding out the impulsive, late-stage entries that typically destroy accounts when market volatility spikes.
Here is an example workflow used to evaluate a potential position:
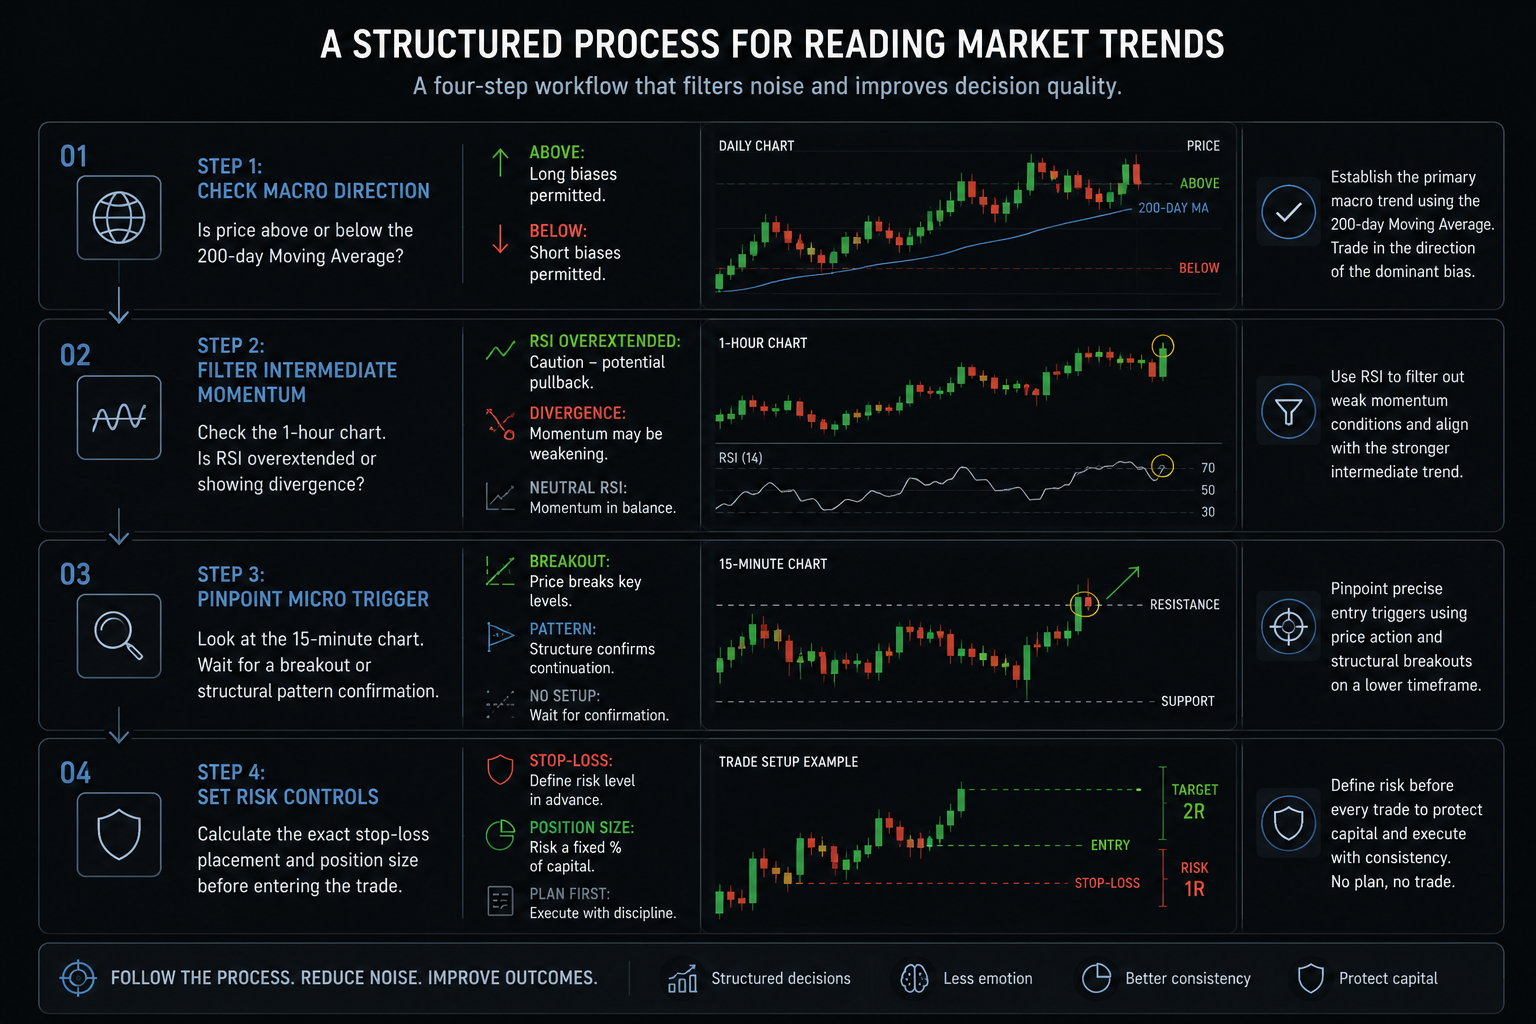
Sticking to a structured routine takes the panic out of live execution, forcing you to make objective trading decisions instead of reacting to every tick. Look at how major funds handle the 200-day moving average. It isn’t a holy grail, and they rarely treat it as an automatic buy-or-sell signal on its own. Instead, they use it purely as a high-level trend filter—a baseline rule that prevents them from buying an asset that is structurally collapsing.
Validating Strategies in Simulated Environments
Before applying a strategy to a live portfolio, it is highly practical to test its parameters through demo trading. Using a simulated account with real-time market feeds lets you practice your execution workflow and get used to platform mechanics without financial risk. It also reveals whether a strategy remains practical once real execution speed, order placement, and routine decision-making become part of the process.
Risk Management: Protecting Capital Against Market Shifts
Common Risks and Analytical Pitfalls to Avoid
The primary danger in market analysis is allowing emotional trading to override predefined rules by modifying a position mid-trade to justify a losing outcome. Consistent traders know that capital preservation matters far more than being right on every single position. Protecting your equity means actively identifying the psychological and operational friction points that systematically drain accounts:
- Information Overload: Piling too many automated tools onto a single chart creates a chaotic trading environment. These conflicting indicators generate mixed signals, turning what should be a binary execution decision into a confusing guessing game that ruins discipline.
- Trading Into Scheduled Volatility: Walking into a major economic release without checking the calendar is pure gambling. Scheduled macro data drops introduce massive institutional volume spikes; trading through them means you risk getting stopped out by random noise and high slippage rather than an actual structural trend change.
- Arbitrary Position Sizing: Changing the amount of capital risked per trade based on excitement rather than sticking to a fixed percentage of total equity.
Combining Technical and Fundamental Insights
Serious investors use charts for timing, but fundamental analysis looks at the macro current. Evaluating corporate financial statements alongside broader economic indicators establishes a realistic anchor for an asset’s valuation before short-term trends develop.
Traditional technical levels frequently dissolve when institutional order flow changes direction. When shifting macro economic conditions force sudden market shifts, professional traders manage the threat through strict account math, ensuring they never risk more than 0.5% to 2% of their total equity on a single setup.
| Analytical Approach | Day Trading Focus | Swing Trading Focus |
| Holding Horizon | Positions opened and closed within a single session. | Positions held for several days, weeks, or months. |
| Primary Data Inputs | Intraday price action, short-term volume, session momentum. | Macro trend structures, daily indicators, fundamental analysis. |
| Volatility Management | Requires tight stop-losses to match smaller intraday targets. | Requires wider stop-losses to give the asset room for daily fluctuations. |
When comparing Day Trading vs. Swing Trading, your risk management parameters must match your chosen holding period. Intraday traders deal with rapid price fluctuations and need to monitor screens closely during active sessions, whereas swing traders look at the bigger picture and accept larger daily price movements in exchange for longer-term targets.
Execution Habits: Online Trading for Beginners with a Clear Plan
Developing a systematic framework to analyze market trends mathematically is the single most effective way to navigate online trading for beginners. While price action changes across different assets, the core principle remains constant, which means learning to evaluate raw data to guide you in making informed investment decisions. To protect your capital from psychological traps, implement these three structural habits:
- Keep a Structured Trading Journal: Track the specific technical and fundamental reasons for every entry. Note which indicators triggered the trade and document whether you followed your plan.
- Determine Risk Controls Prior to Entry: Always input your protective stop-loss order into the terminal at the exact moment you open a position. Avoid moving your stop further away to give a losing trade more time.
- Set Routine Boundaries: Avoid over-analyzing charts outside of your planned trading hours. Spending hours staring at a stagnant market often leads to forced trades based on boredom rather than data.
Markets will always remain uncertain, regardless of how much data is available. The advantage comes from following the same structured process under different market conditions, allowing probabilities rather than emotions to shape each decision.