Financial markets no longer suffer from a lack of information. The challenge for investors is turning fragmented data into a clear view of performance, risk and portfolio exposure.
Investors today have access to more financial information than at any other point in market history. Stock prices update in real time, ETF holdings are widely available, earnings data can be reviewed in seconds and portfolio performance can be tracked across multiple platforms.
This abundance of information has changed the investment process. The main challenge is no longer access to data, but interpretation. Investors need to understand which metrics matter, how different assets interact and how market information connects to their own portfolios.
As a result, financial data platforms are becoming a more important part of modern investing. By centralizing market data, rankings, charts, dividend information and portfolio tracking tools, these platforms help investors move from fragmented information toward a more structured analytical process.
The investment problem has shifted from access to interpretation
Digital finance has made investing more accessible. Individual investors can follow global stocks, ETFs, crypto assets, commodities and macroeconomic indicators from different devices and platforms. They can read company news, compare charts, review financial statements and monitor price movements almost instantly.
However, more information does not automatically lead to better decisions. When data is spread across multiple sources, investors may struggle to understand how each signal fits into the broader picture. A stock may be rising, but the move may be driven by earnings, sector momentum, valuation changes or short-term sentiment. An ETF may appear diversified, while its largest holdings create concentrated exposure to the same companies or industries.
This is why interpretation has become so important. Investors need tools that help organize data, compare assets and connect market information to portfolio context.
Portfolio intelligence depends on connected data
Portfolio intelligence is not only about knowing whether an asset has gone up or down. It requires a connected view of performance, allocation, income, volatility and exposure.
For example, investors may need to understand how much of their portfolio is concentrated in technology, how dividend-paying assets contribute to income, how ETFs overlap with individual stock positions or how different asset classes respond to changing interest rates.
These questions require more than isolated data points: they depend on the ability to connect information across assets and categories. When financial data is organized in one environment, investors can evaluate their portfolios with more clarity and identify patterns that may be harder to see when information is fragmented.
Connected data also supports consistency. Instead of reacting only to market noise, investors can review performance, allocation and risk through a more stable framework.
Stocks and ETFs require different data layers
Stocks and ETFs are both central to modern portfolios, but they require different analytical approaches.
When analyzing individual stocks, investors often look at company fundamentals such as revenue, net income, margins, debt, valuation ratios, dividend history and historical performance. These indicators can help show whether a business is growing, how efficiently it operates and how the market is valuing its future expectations.
ETFs require a different layer of research. Investors need to understand the underlying index, holdings, sector exposure, geographic allocation, expense ratio, liquidity and performance history. A broad-market ETF, a dividend ETF and a technology ETF may behave very differently, even if they are all traded in the same market.
This distinction becomes especially important when portfolios combine both stocks and ETFs. An investor may hold shares in major technology companies while also owning ETFs that are heavily exposed to the same names. Without reviewing allocation and overlap, the portfolio may become more concentrated than it appears.
Rankings and visual tools make data easier to compare
One reason financial data platforms have gained relevance is that they make comparison more practical. Rankings, charts and visual tools help investors organize large amounts of information without relying only on headlines or isolated price movements.
Rankings can group stocks and ETFs according to defined criteria, such as market performance, valuation indicators, dividend metrics or investor interest. Charts make it easier to review how an asset has behaved over time, while dividend calendars help investors follow relevant payment dates and income distribution patterns.
These tools do not replace analysis, but they make the research process more accessible. They allow investors to filter information, compare assets and identify which areas may deserve further review.
In this sense, data visualization is not only a design feature. It is part of how investors transform raw information into something easier to interpret.
Portfolio tracking turns market data into personal context
Market data becomes more useful when investors can connect it to their own financial position. A stock may be performing well, an ETF may be attracting attention or a sector may be gaining momentum, but the practical impact depends on the investor’s existing exposure.
Portfolio tracking helps create this connection. By monitoring allocation, performance, asset distribution and dividends received, investors can better understand how each position contributes to the overall portfolio.
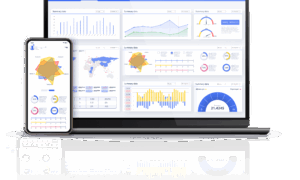
Platforms such as Investor10 can support this shift by bringing together financial data, stock and ETF rankings, charts, dividend calendars and portfolio tracking tools in one environment. Rather than replacing independent judgment, these resources help investors organize information, compare assets and understand how market data connects to real portfolio exposure.
This type of visibility is especially relevant as investors diversify across different asset classes, sectors and markets. A new position may improve diversification, but it may also increase concentration in a theme the investor already holds. Without portfolio-level context, that distinction can be difficult to identify.
The next stage of fintech is clarity
Fintech has often been associated with speed, automation and broader access to markets. These advances remain important, but the next stage of investment technology is also about clarity.
Investors do not only need faster information. They need better ways to interpret it. Artificial intelligence, automation and real-time data can be useful, but their value depends on whether they help users ask better questions and build a more organized investment process.
Which assets are driving performance? Where is the portfolio concentrated? How consistent is dividend income? Are ETFs creating overlap with individual holdings? How does a new investment change overall exposure?
Financial data platforms can help answer these questions by turning scattered data into structured insight. In a market environment shaped by constant information flows, portfolio intelligence is becoming less about having more data and more about understanding what that data means.
Disclaimer
This article is for informational and educational purposes only and does not constitute financial, investment, tax or trading advice. Any tools, platforms, rankings, metrics or indicators mentioned are provided as examples for research and analysis purposes and should not be interpreted as recommendations to buy, sell or hold any security, ETF or financial product.
Investing involves risk, including the potential loss of capital. Investors should conduct their own independent research and, where appropriate, consult with a qualified financial professional before making financial decisions. Past performance is not indicative of future results.