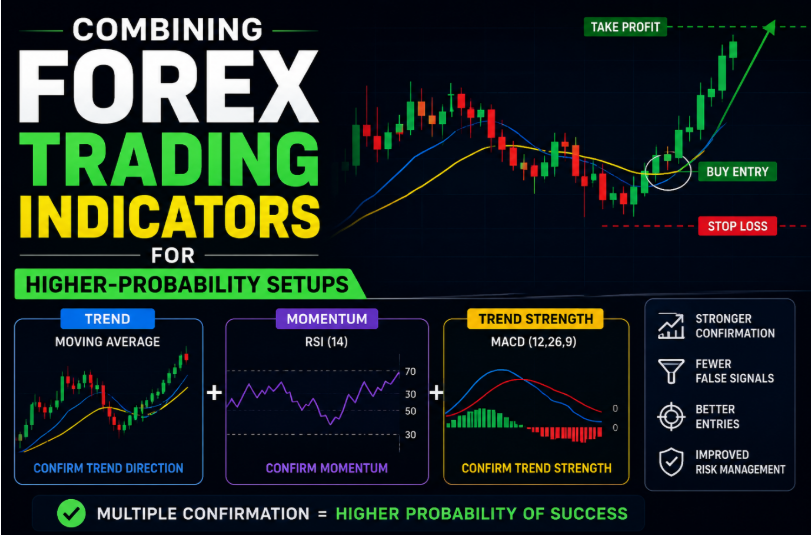
When you open any trading platform, you find dozens of tools promising to reveal where the market is headed next. Still, the most experienced traders will tell you the same thing, i.e, no single tool tells the whole story. Each one has its own strengths and limitations, too. This is why so many traders combine multiple forex trading indicators to build a clearer and more balanced view of market conditions before acting.
In this blog, we will learn how to combine these indicators for higher-probability setups and make informed decisions.
What are Forex Trading Indicators?
Forex trading indicators are mathematical calculations based on price, volume, or time, plotted directly onto a chart to help traders interpret market conditions. They don’t predict the future, but they summarise what’s already happened in a way that’s easier to visualise.
Broadly, indicators are categorised into the following:
- Trend indicators, such as moving averages. It helps identify the general direction of the market.
- Momentum indicators, like RSI and MACD. It measures the speed and strength of price movement.
- Volatility indicators, such as Bollinger Bands. It shows how much the price is expanding or contracting.
Traders use these tools to support technical analysis, spot potential market trends, and identify areas where support and resistance may come into play.
Why Combine Forex Trading Combinations?
Relying on just one indicator can produce false signals, particularly in choppy or low-volatility conditions. An RSI reading showing “overbought” conditions, for example, doesn’t necessarily mean the price will reverse. In fact, a strong trend can keep RSI elevated for extended periods.
This is where price action becomes essential. Recognising a candlestick chart pattern, such as an engulfing pattern or a doji, near a key level can help confirm what an indicator is suggesting, rather than acting on the indicator signal alone.
Combining complementary indicators, rather than duplicating the same signal, can help build a more complete picture of market conditions.
Popular Forex Trading Indicator Combinations
Certain pairings are widely used because they balance different types of market information. Below are a few common combinations of Forex trading indicators.
- Volume or Volatility Analysis + Bollinger Bands: Contraction and expansion occur in Bollinger Bands because of market volatility. If the price touches the outer band along with a noticeable change in volume, it can indicate strengthening or weakening momentum.
- Support and Resistance + MACD: MACD is a momentum indicator that can help identify shifts in momentum and potential trend changes. When a MACD crossover occurs near a well-established support or resistance level, it can add extra weight to that signal compared to a crossover occurring in the middle of a trading range.
- RSI + Moving Average: A moving average is a trend indicator that can help confirm the direction of the broader trend. On the other hand, RSI can add insight into momentum and potential exhaustion points. In a situation where price is above a rising moving average and RSI shows strong but not extreme momentum, this combination can be used to support continued trend strength.
- Momentum Indicators + Trend Indicators: Pairing a trend-following tool with a momentum-based one is one of the most common approaches that professionals follow. The trend indicator establishes direction, while the momentum indicator helps assess whether that move still has strength behind it.
| Combinations | What it Helps Assess? |
| Moving Average + RSI | Trend direction and momentum exhaustion |
| MACD + Support/Resistance | Momentum shifts at key price levels |
| Bollinger Bands + Volume | Volatility changes and potential breakouts |
| Trend + Momentum Indicators | Overall trend strength and continuation |
Here is a practical example:
Let’s say that a currency pair is trading above a rising 50-period moving average, with RSI showing healthy but not overextended momentum. Price then approaches a known resistance level and forms a bearish candlestick chart pattern.
Individually, each of these observations offers limited insight. Together, they can help traders build a more informed view, one that considers trend, momentum, and price action rather than a single isolated signal.
Common Mistakes to Avoid While Combining Forex Trading Indicators
Below are some of the common mistakes that every trader should avoid while using different Forex trading indicators in combination with each other:
- Indicator overload: Do not use multiple indicators at a single time. This is because using too many indicators at once can create cluttered charts and conflicting signals.
- Combining similar indicators: Using two momentum indicators together, for example, may simply duplicate the same information rather than adding new insight.
- Ignoring the broader context: It cannot be denied that indicators can help you tell the market story, but they should not be used separately. It is recommended to always interpret the meaning in the context of the broader price action and market structure.
- Neglecting risk management: even a well-confirmed setup carries risk, and position sizing and stop-loss placement remain essential.
Best Practices for Combining Forex Indicators
Expert traders do not randomly combine indicators and expect them to work perfectly, and neither should you. Here are some of the best practices that you can follow
- Choose indicators that measure different aspects of the market, such as trend, momentum, and volatility.
- Limit your chart to two or three indicators to avoid unnecessary complexity.
- Match your indicator choice to your trading strategy and preferred timeframe.
- Never view indicator signals alone. Always check it along the price action and key support and resistance levels.
Conclusion
In the end, Forex trading indicators can offer valuable insight, but they will work best if you consider them a part of a broader analytical process rather than as standalone signals. You may be able to identify higher-probability setups with greater confidence if you thoughtfully combine complementary indicators and confirm signals with price action.
But always remember that your choice of indicators should support a well-defined trading plan and sound risk management, but not replace them.