Every January, a16z publishes its annual fintech “State of the Market” report. The 2024 edition ran to 80 pages, covered 14 market segments, and included proprietary data from a16z’s portfolio of over 100 fintech companies. The report took three analysts six weeks to produce. Within a month of publication, it had been downloaded 200,000 times, cited in 43 media articles, referenced in at least 12 competitor pitch decks, and used as a framework document in three regulatory consultations. a16z does not charge for the report. It does not gate it behind an email form. The firm publishes it openly because the report’s value to a16z is not in lead generation. The value is in category definition: by publishing the most comprehensive analysis of the fintech market each year, a16z ensures that the industry’s understanding of itself is shaped by a16z’s framework. When founders, investors, and regulators discuss fintech market dynamics, they are often discussing them in terms that a16z defined.
The Strategic Logic Behind Publishing Industry Analysis
Fintech companies publish industry analysis for reasons that extend well beyond marketing. The decision to invest significant resources in producing and distributing market research reflects four strategic calculations, each of which affects different dimensions of the company’s competitive position.
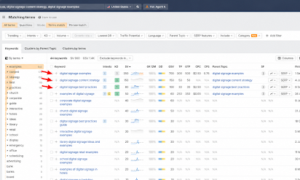
The first calculation is market narrative control. The company that publishes the most comprehensive analysis of a market segment gets to define the categories, the metrics, and the framework through which that segment is understood. When Plaid publishes its annual report on financial data connectivity, the categories Plaid uses (account linking, transaction data enrichment, identity verification) become the categories the industry uses. Competitors then find themselves operating within a market structure that Plaid defined, which is inherently advantageous for Plaid.
The Boston Consulting Group projects fintech revenues will reach $1.5 trillion by 2030, with embedded finance and digital lending accounting for the largest share of projected growth.
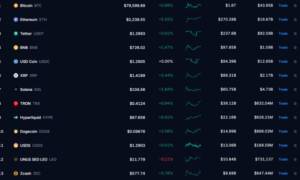
According to CB Insights’ 2024 fintech report, global fintech funding declined 40 percent between 2022 and 2024, pushing the sector toward consolidation and a sharper focus on profitability over growth at all costs.
The second calculation is customer education at scale. Enterprise fintech sales require the buyer to understand not just the product but the market context in which the product operates. A treasury management platform is more compelling to a CFO who understands why real-time payments are restructuring corporate cash management. Industry analysis educates thousands of potential customers simultaneously, creating a pool of informed prospects who are pre-educated on the problem the product solves. The Content Marketing Institute’s 2025 B2B research found that 58% of B2B companies report increased sales from content marketing. In fintech, that increase is concentrated among companies whose published analysis does the educational work that would otherwise fall on the sales team.
The third calculation is competitive intelligence signalling. When a fintech company publishes analysis that demonstrates deep understanding of market dynamics, competitors learn that the company is tracking their sector with analytical rigour. This knowledge affects competitive behaviour: competitors are less likely to make false claims about market share or product capabilities when they know the claims will be checked against a well-informed competitor’s published analysis.
The fourth calculation is talent and investor attraction. Analysts, product managers, and engineers evaluate potential employers partly on the quality of the company’s published thinking. A fintech company that produces rigorous industry analysis signals that it hires smart people, thinks carefully about its market, and makes data-driven decisions. These signals attract the calibre of talent that further strengthens the company’s analytical capabilities, creating a self-reinforcing cycle.
What Makes Fintech Industry Analysis Valuable
Not all industry analysis generates the strategic returns described above. The difference between valuable industry analysis and generic market commentary lies in three characteristics that determine whether the analysis earns attention or disappears into noise.
The first characteristic is proprietary data. Analysis built on data that only the publishing company can access is inherently more valuable than analysis built on publicly available information. A payments company analysing transaction patterns across its merchant network, a lending platform examining default rates by industry segment, or a banking platform reporting on deposit flow dynamics each produces findings that no other entity can replicate. This exclusivity makes the analysis worth reading, citing, and sharing.
The second characteristic is actionable interpretation. Data without interpretation is a spreadsheet, not analysis. Valuable industry analysis explains what the data means for specific audiences: what founders should do differently, where investors should focus attention, how regulators should think about emerging risks. A report showing that cross-border payment volumes grew 15% year over year is data. A report explaining that the growth was concentrated in three corridors, driven by specific regulatory changes, and likely to shift to different corridors next year is analysis that readers can act on.
The third characteristic is intellectual honesty. The most valuable industry analysis acknowledges uncertainty, identifies counter-arguments, and avoids the promotional tone that discredits most company-published research. According to DemandSage’s 2025 content marketing data, 83% of marketers prioritise quality over quantity. In fintech industry analysis, quality means honest assessment, even when the honest assessment does not flatter the publishing company’s market position. Readers, particularly the sophisticated readers that fintech analysis targets, detect and penalise promotional bias. Analysis that acknowledges where the company’s own product falls short is paradoxically more credible than analysis that presents an unrealistically positive view.
The Production Economics of Industry Analysis
Producing industry analysis at a level that generates strategic returns requires significant investment, but the economics are favourable when compared to alternative marketing channels.
A comprehensive quarterly industry report typically requires 200 to 400 hours of work: data collection and analysis (80 to 150 hours), research and writing (60 to 120 hours), design and formatting (20 to 40 hours), editorial review and fact-checking (20 to 40 hours), and distribution and promotion (20 to 50 hours). At a blended cost of $100 per hour for analyst and editorial time, each report costs $20,000 to $40,000 to produce.
Compare that to the cost of generating equivalent business outcomes through paid channels. If a quarterly industry report generates 50 qualified enterprise leads (a conservative estimate for well-produced analysis in a market with strong demand), the cost per lead is $400 to $800. Enterprise fintech companies typically pay $2,000 to $5,000 per qualified lead through paid channels. The report also generates media coverage (estimated value of $10,000 to $50,000 in equivalent advertising), search authority improvements (permanent value that compounds), and brand equity that does not depreciate with each publication cycle.
The production economics improve further when the company builds a dedicated research function rather than producing analysis ad hoc. A full-time fintech analyst producing one comprehensive report per quarter and two to three shorter analyses per month costs $120,000 to $180,000 annually in total compensation. That analyst’s output, if consistently meeting the three quality characteristics described above, typically generates more attributable pipeline value than an equivalent investment in any other marketing channel.
Distribution Strategies for Maximum Impact
Producing excellent industry analysis is necessary but not sufficient. The analysis must reach the audiences that generate business value, and reaching those audiences requires deliberate distribution across multiple channels.
The first distribution channel is the company’s own website and email list. This channel reaches the existing audience and provides a permanent, searchable home for the analysis. Every future reader who discovers the analysis through search arrives at the company’s own website, which maximises the opportunity for conversion.
The second channel is industry publications. Adapted versions of the analysis, tailored to each publication’s audience and editorial standards, extend reach to readers who do not follow the company directly. A fintech company that publishes its quarterly analysis in its own blog and also places a summary or adapted version in Finextra, Payments Dive, or TechBullion reaches different audiences through each channel.
The third channel is social media, particularly LinkedIn and Twitter, where fintech professionals consume industry commentary. The distribution strategy for social media is different from long-form publication: short excerpts, individual data points, and provocative findings work better than sharing the full report link. Each social post drives some traffic back to the full report and introduces the company’s analysis to the reader’s network.
The fourth channel is direct distribution to high-value contacts. Sending the report directly to key prospects, partners, regulators, and journalists ensures that the highest-priority audiences receive it regardless of whether they would have discovered it through other channels. This direct distribution is the most labour-intensive but also the most targeted, and it often produces the highest-value business outcomes because the recipients are selected for their strategic importance.
a16z’s annual fintech report succeeds across all four channels because the firm has invested in building each distribution capability over years. The report’s initial audience was a16z’s portfolio company founders. Today it reaches hundreds of thousands of readers because the distribution network expanded with each annual edition. Every fintech company that commits to producing and distributing industry analysis can build equivalent distribution over time. The investment compounds: each edition’s distribution network carries the next edition further, and each new reader who finds value in the analysis becomes a repeat audience member who anticipates the next publication.