
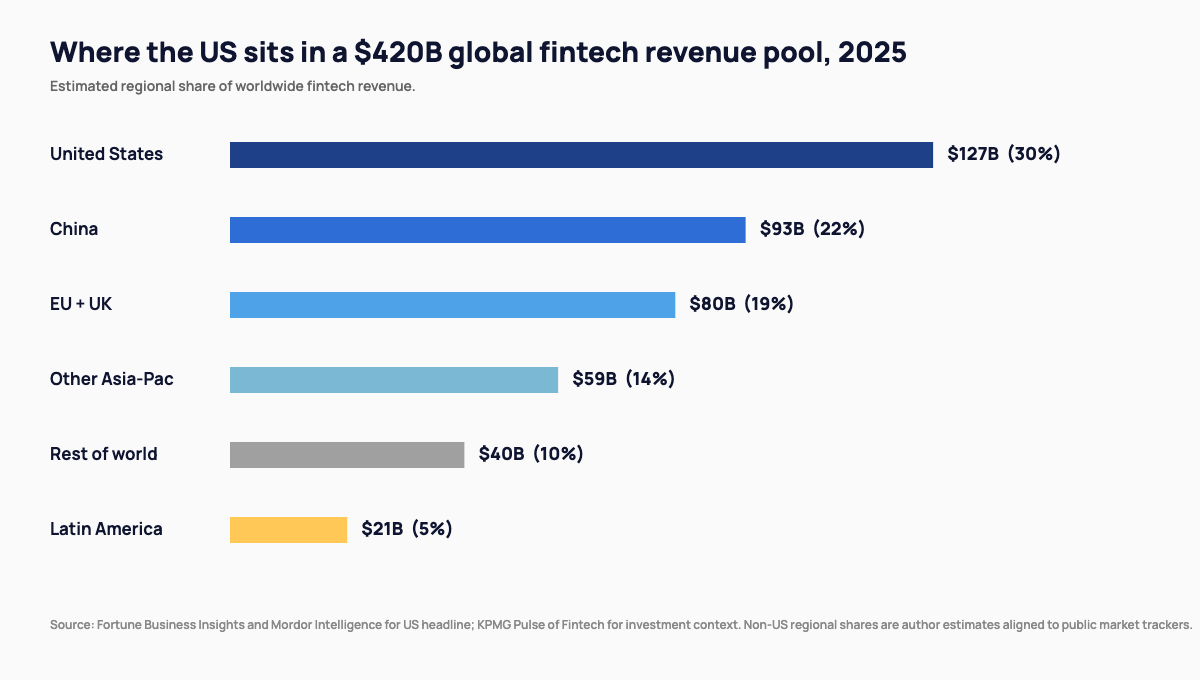
Reading “global fintech trends” from inside the US is a different exercise than reading them from anywhere else, because the US is both the largest single fintech market by absolute revenue and a comparatively mature one. The country’s roughly $127 billion regional fintech revenue pool sits inside a global market of around $420 billion in 2025, according to Fortune Business Insights. That makes the US about 30 percent of worldwide fintech revenue, even though it accounts for under 5 percent of the world’s population.
That asymmetry shapes everything about how US fintechs read global trends. They are not chasing a market they could leapfrog into. They are operating inside a saturated payments environment, a deeply established credit-bureau infrastructure, and a regulatory perimeter that has been tested over decades. The trends that matter for US fintech are different from the ones that matter for fintechs in Brazil, Indonesia, or Nigeria, and treating the global numbers as one homogenous pool is the fastest way to misread what is actually happening inside the US.
What follows is an attempt to read the global numbers honestly from a US vantage point: how big the US share actually is, where it is concentrated, what the trajectory looks like through 2030, and how it compares to the other major regional markets that are growing faster from smaller bases. The takeaways are pointed at founders and investors operating in or near the US fintech market, where the strategic question is no longer whether to participate but how to position against the next round of cross-border product flow.
How big the US share actually is, in context
The headline US figure of $127 billion in 2025 fintech revenue is consistent across the major market trackers. Mordor Intelligence puts the figure at $124 billion. Fortune Business Insights reports a similar number with a slightly different segment cut. KPMG’s Pulse of Fintech tracks investment rather than revenue, but its dollar-flow analysis tells the same story: US capital deployment leads the world by a meaningful margin, even after the 2022-2023 funding contraction.
Two contextual numbers matter alongside the headline. The first is the US share of global fintech investment, which has averaged 40 to 45 percent of total worldwide capital flow over the past five years. The second is the US share of global fintech revenue, which sits closer to 30 percent. The gap between investment share (40 to 45 percent) and revenue share (30 percent) signals an investor expectation that US fintechs are not yet fully monetised, even at the current scale. That gap is one of the most-watched leading indicators in cross-border fintech analysis, and it explains why valuation multiples in the US still command a premium even when growth rates lag emerging-market peers.
A third number completes the picture: average revenue per fintech user inside the US is roughly four to five times the global average, driven by higher card-spend velocity, deeper credit penetration, and broader product attachment per customer. That ARPU advantage is what keeps US fintechs investable even when international peers post faster top-line growth, because absolute dollar contribution per cohort still favours the US at scale.
Where investment dollars go, and what adoption follows
Investment concentration inside the US looks different from the country averages elsewhere. Roughly 35 percent of 2024-2025 US fintech investment dollars went to payments, 20 percent to lending, 15 percent to wealth and brokerage, 12 percent to insurance technology, and the remainder to infrastructure, banking-as-a-service, and crypto-adjacent plays. That distribution is more concentrated in payments than the global average, which spreads more evenly across lending and wealth in non-US markets.
Adoption follows the investment with a roughly 18-month lag, and the pattern repeats reliably enough that US adoption can be forecast from US investment with reasonable confidence. The categories that absorbed the largest investment dollars in 2022-2023 are now the ones showing the largest user-base growth in 2025 reports. The implication is that the largest growth surface for US fintechs through 2027 will be in embedded financial products, real-time payments, and AI-augmented underwriting, because those are exactly where 2024-2025 investment concentrated. Operators planning the next 24 months should treat the 2024-2025 deal data as the most reliable forward signal available, more reliable than survey data or analyst forecasts.
How segments split, and what the 2030 trajectory implies
Inside the US market, segment splits hold roughly steady. Payments leads at 38 percent, lending sits second at 27 percent, wealth at 18 percent, and insurance at 12 percent, with the remainder spread across infrastructure plays. Those proportions move slowly because they are anchored to underlying financial activity, not to fintech-internal trends, and that anchoring is what makes the US fintech revenue mix more predictable than its valuations.
Looking forward, the 2030-2034 trajectory for US fintech projects the regional revenue pool reaching roughly $200 to $220 billion by 2030 and $260 to $280 billion by 2034. That implies a compound annual growth rate of around 8 to 10 percent across the period. The growth distribution is uneven: insurtech and embedded finance lead at 12 to 15 percent CAGR, while traditional payments and consumer lending grow at the lower end of the range. That gradient shapes where venture capital and corporate development teams are spending most of their attention, and it explains why every M&A conversation in 2025 includes the words “embedded” or “real-time” somewhere in the deck.
Where US fintech sits against international peers
International comparison is where the global trends story gets interesting for US founders and investors. The UK and EU together represent about $80 billion of fintech revenue in 2025, with the UK alone at roughly $35 billion. China sits at around $93 billion, weighted heavily toward payments and consumer lending and operating under a tighter regulatory regime than the US. India has a smaller absolute revenue base around $30 billion, but the highest growth rate of any major market, with adoption rising from a lower base and pulled forward by the unified payments interface and Aadhaar-linked digital identity infrastructure.
What the comparison reveals is that the US leads on absolute revenue and on investment volume, but lags on consumer-side adoption velocity in selected categories like real-time payments and unified payments interfaces, where India and Brazil have leapfrogged. Open innovation in US finance partnership flows are increasingly looking outside the country for ideas worth importing, particularly in mobile-first banking interfaces and instant credit underwriting. The flow of ideas is no longer one-way out of Silicon Valley, and the US fintechs that recognise that earliest are positioned to lead the next product cycle.
What founders should take from the data
The practical takeaway for founders building inside the US is that local market depth is an advantage, not a constraint. The $127 billion revenue pool is large enough to support a multi-billion-dollar company in any of the four core segments, and the regulatory rails (CFPB, OCC, Federal Reserve) are well-defined enough to underwrite long-term planning. That depth is the reason US fintechs can build for high lifetime value, multi-product expansion, and regulated-channel partnerships in ways that fintechs in shallower markets cannot, and that durable advantage is worth pricing into the early product roadmap.
For investors, the lesson is that the US is no longer the universal default destination for fintech capital. The global growth-rate gap, particularly in India, Southeast Asia, and Latin America, is meaningful enough that an internationally diversified fintech portfolio is now a defensible thesis. The discipline that pays for itself, repeatedly, is reading the international growth-rate data alongside US revenue scale, and pricing risk on the basis of regulatory and unit-economic specifics rather than headline market size. Following credit decision engines innovation across borders is one concrete way to spot which infrastructure plays travel well between regulatory regimes.