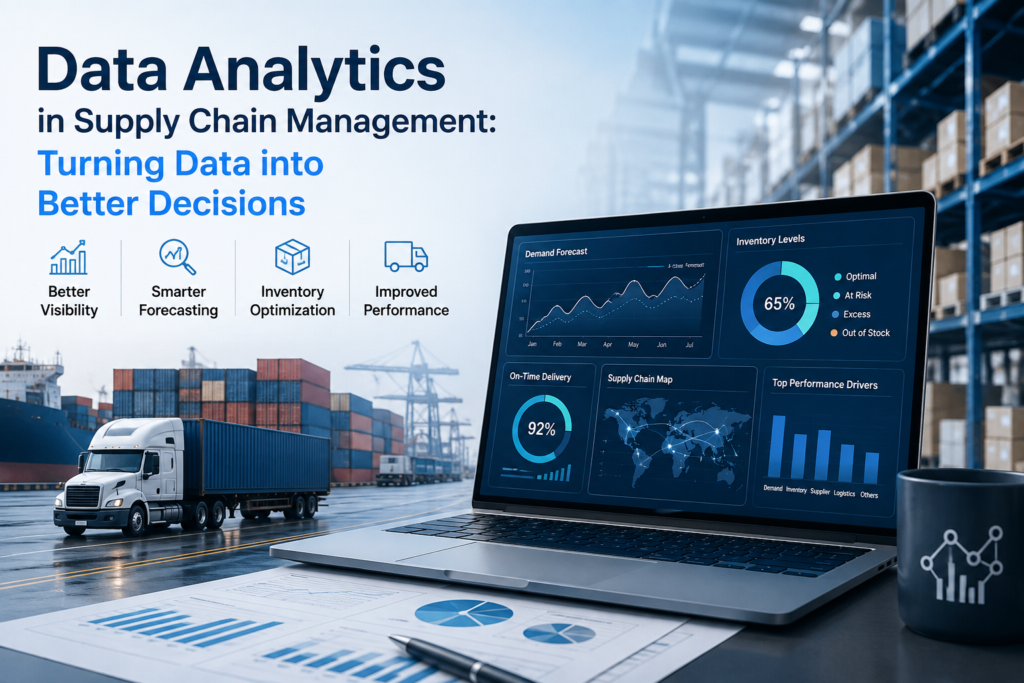
A supply chain can generate an enormous amount of data without giving its managers a clear picture of what is happening.
Orders are moving through the system. Inventory levels change every day. Suppliers send updates. Warehouses record receipts and dispatches. Logistics teams track shipments. Customer demand moves in a different direction.
The data is there.
The difficult part is connecting it.
A delayed shipment, for instance, may look like a logistics problem. But the reason could be a supplier issue, an inaccurate inventory record, a sudden change in demand or a planning decision made weeks earlier.
This is where data analytics in supply chain management becomes useful. Instead of looking at individual events in isolation, organizations can bring information from different parts of the supply chain together and use it to understand what is happening, why it is happening and where attention is needed.
And the opportunity is getting bigger. With better data platforms, predictive analytics and AI, supply chain teams can move beyond reporting yesterday’s problems and start identifying potential issues earlier.
What Is Data Analytics in Supply Chain Management?
In simple terms, data analytics in supply chain management means using supply chain data to understand performance and support operational and strategic decisions.
That data can come from many places:
- Procurement and supplier systems
- ERP platforms
- Warehouse management systems
- Transportation and logistics systems
- Inventory records
- Sales and demand data
- Production systems
- External market information
The interesting part isn’t any one of these sources.
It is what happens when they are looked at together.
Take inventory as an example. A report might tell a supply chain manager that a particular item has been sitting in the warehouse for 90 days.
That’s a fact.
But it doesn’t explain why.
Perhaps demand has fallen. Perhaps the purchasing team ordered too much. Maybe the item is being held because another component is unavailable. Or the inventory record itself could be inaccurate.
Analytics gives the team a way to investigate those connections instead of simply reporting the number.
Why Does Supply Chain Analytics Matter?
Supply chains have very little room for decisions based purely on assumptions.
Too much inventory ties up working capital. Too little inventory can result in stockouts. A late supplier can affect production. An inaccurate demand forecast can create problems several stages downstream.
The difficult part is that these issues are connected.
A purchasing decision can affect inventory. Inventory affects warehouse operations. Warehouse availability affects order fulfillment. Transportation decisions affect delivery performance and customer experience.
This is why looking at each part separately can be misleading.
Data analytics helps create a broader view.
It can also change how quickly teams respond.
Without analytics, a supply chain manager may discover a problem when a customer order is already late. With better monitoring, the same organization might notice that inventory is falling faster than expected or that a supplier’s delivery performance has been deteriorating for several weeks.
That difference matters.
The earlier a problem becomes visible, the more options the business usually has.
Where Is Data Analytics Used in Supply Chain Management?
There isn’t one single use case that defines supply chain analytics. Different organizations use it to answer different questions.
Demand forecasting
Demand is one of the hardest things to predict because it rarely follows a perfectly stable pattern.
Historical sales provide a starting point, but they aren’t always enough. Seasonality, promotions, market conditions, customer behavior and other factors can change the picture.
Analytics can help planners examine historical patterns and compare expected demand with what actually happened.
The goal isn’t to produce a forecast that is magically correct every time. No forecast can do that.
The goal is to give planners better information about where demand may be changing and where the forecast needs closer attention.
Inventory optimization
Inventory is always a balancing act.
Holding too much means more capital tied up in stock, storage costs and the possibility of obsolescence.
Holding too little creates a different problem.
Analytics can help identify slow-moving inventory, stockout patterns, excess stock and differences between locations.
For example, one warehouse may have surplus inventory while another location is repeatedly ordering the same item. That situation can be difficult to spot when inventory is managed separately by location.
Once the data is brought together, the opportunity becomes much easier to see.
Supplier performance
Supplier performance isn’t just about whether an order arrived.
Procurement and supply chain teams may want to look at delivery reliability, lead times, quality problems, order quantities and changes in supplier behavior over time.
A supplier that was consistently reliable six months ago may now be missing delivery dates more often.
That trend is more useful than a single monthly performance score.
Analytics gives teams a way to look at the pattern.
Procurement and sourcing
Supply chain analytics also has a close relationship with procurement.
Supplier prices, purchasing volumes, lead times and supplier performance can be examined together to understand where sourcing decisions may be affecting supply chain performance.
This is where organizations often start connecting spend analytics with operational data.
A lower purchase price may look attractive until longer lead times result in higher inventory requirements. Similarly, consolidating suppliers may improve commercial leverage but increase dependency on a smaller supplier base.
The better decision depends on the whole picture.
Logistics and transportation
Transportation generates plenty of useful information: shipment times, routes, carrier performance, freight costs and delivery exceptions.
Analytics can help identify recurring delays, expensive routes or differences in carrier performance.
It can also help distinguish between isolated incidents and recurring problems.
That distinction is important. One delayed shipment isn’t necessarily a reason to change a logistics strategy. A pattern of delays on the same route is a different matter.
What Supply Chain Metrics Should Companies Track?
There is a temptation to measure everything once the data becomes available.
That usually isn’t helpful.
The better approach is to connect metrics to decisions.
For inventory, teams may track inventory turnover, days of inventory, stockout frequency, excess inventory and order fulfillment.
For suppliers, useful measures can include on-time delivery, lead-time variation, quality performance and supplier concentration.
For logistics, teams might look at transportation costs, delivery performance, transit times and carrier performance.
Demand planning may focus on forecast accuracy, forecast bias and the difference between planned and actual demand.
The exact metrics depend on the business.
A manufacturer with complex production requirements will have different priorities from an e-commerce company managing thousands of customer orders every day.
The KPI itself isn’t the goal.
The question is what the team does when the KPI changes.
What Makes Supply Chain Data Analytics Difficult?
This is the part that often gets overlooked.
People usually see the dashboard first.
They don’t see what had to happen to the data before the dashboard could be trusted.
Supply chain information can be spread across multiple systems, and those systems don’t always use the same definitions.
One system may identify a supplier using a company name. Another may use a supplier code. Product descriptions can vary between locations. Units of measurement may not be consistent.
Even something as basic as lead time can be calculated differently across systems.
If those differences aren’t addressed, the resulting analysis can be misleading.
Data quality therefore matters just as much as the analytical model.
A sophisticated algorithm working with unreliable data isn’t going to produce reliable supply chain intelligence.
How Is AI Changing Supply Chain Analytics?
AI is making supply chain analytics more interesting, particularly because supply chains generate large volumes of data and many decisions depend on recognizing patterns.
One practical application is anomaly detection.
Instead of asking someone to review every shipment, transaction or inventory movement, analytical models can flag activity that looks unusual.
Maybe a supplier’s lead time suddenly changes.
Maybe inventory consumption is behaving very differently from the historical pattern.
Maybe transportation costs on a particular route have moved sharply.
The model doesn’t necessarily tell the team what to do.
It points to something worth investigating.
AI can also help with demand forecasting, supplier analysis, inventory planning and natural-language interaction with supply chain data.
Imagine a supply chain manager asking:
“Which products are showing unusual demand changes this month?”
Or:
“Which suppliers have had the largest increase in delivery delays?”
That kind of interaction can make analytical information easier for business users to explore.
But there is an important qualification.
AI works best when the underlying data is reliable and the business context is understood.
Supply chains contain plenty of exceptions. A sudden change in demand may be an error, but it could also be a major customer order. A supplier delay may be a problem, or it may be the result of a deliberate change in production.
Someone still needs to understand the context.
What Is the Difference Between Supply Chain Analytics and Supply Chain Visibility?
The two ideas are closely connected, but they aren’t identical.
Supply chain visibility is about knowing what is happening across the supply chain.
Where is an order? How much inventory is available? Which shipments are delayed? Which suppliers are performing?
Analytics takes the information further.
Why are certain shipments repeatedly delayed?
Why is inventory increasing at one location while another is experiencing shortages?
What might happen if demand changes?
That distinction matters.
A supply chain can have excellent visibility and still struggle to make good decisions if nobody is analyzing what the information means.
A dashboard tells you what is happening.
Analytics helps you investigate why.
How Can Companies Get Started?
The best place to start isn’t necessarily the most advanced technology.
Start with a problem.
Maybe inventory is consistently higher than expected. Maybe supplier delivery performance is affecting production. Perhaps transportation costs have increased without an obvious reason.
Choose one area where better information could lead to a measurable improvement.
Then identify the data needed to investigate it.
Where does the information live? Are the definitions consistent? Can data from procurement, inventory and logistics be connected?
Once the foundation is in place, build the analysis around the business question.
That approach is usually more useful than starting with a dashboard and then trying to find a problem for it to solve.
What Does the Future Look Like?
Supply chain analytics is moving in a fairly clear direction.
Teams are becoming less dependent on reports that simply explain what happened at the end of a reporting period.
The more interesting question is what can be identified earlier.
A supplier showing signs of declining performance.
A product whose demand pattern is changing.
Inventory building up in a location where it isn’t needed.
A transportation route becoming consistently more expensive.
These are situations where predictive analytics and AI can add value by helping teams focus their attention before the problem becomes larger.
But technology isn’t going to eliminate supply chain uncertainty.
There will always be unexpected demand, supplier disruptions and events that weren’t in the original plan.
The advantage comes from seeing more of the picture and having better information when something changes.
Choosing the Right Supply Chain Analytics Approach
Organizations don’t necessarily need a massive analytics transformation to start seeing value.
The better approach is usually to connect analytics to a specific business outcome.
That might mean reducing excess inventory, improving supplier reliability, increasing forecast accuracy or understanding transportation costs.
The technology should support that objective.
For companies evaluating a supply chain analytics service, the same principle applies. Look beyond the dashboard and ask how the underlying data will be integrated, how data quality will be handled and whether the analytics will actually fit the decisions supply chain teams need to make.
That foundation makes a much bigger difference than having the most impressive-looking interface.
Final Thoughts
Supply chain data is already being generated every day.
The challenge is turning that information into something useful before a problem reaches the customer.
Data analytics can help connect procurement, suppliers, inventory, logistics and demand so teams aren’t forced to view each part of the supply chain in isolation.
The most valuable outcome isn’t another report.
It’s knowing where to look.
Sometimes that means finding excess inventory before it becomes obsolete. Sometimes it means spotting a supplier whose performance is slipping. Sometimes it means understanding why two locations are handling the same product very differently.
And increasingly, AI can help teams find those patterns faster.
For organizations working with a data analytics company in Chennai or elsewhere, the important question isn’t simply whether analytics is available. It’s whether the analytics is connected to the operational decisions that matter.
That’s where supply chain analytics starts becoming more than visibility.
It becomes a way to make the supply chain more responsive, informed and easier to manage.