Every few weeks, a new model tops a coding benchmark, and a familiar cycle begins: someone posts the chart, engineering Slack channels light up, and somewhere a team lead schedules a migration. Three sprints later, the model is quietly rolled back — not because the benchmark lied, but because it measured the wrong thing.
The question developers actually type into search engines — “what is the best LLM for coding” — has no stable answer. What it has is a stable structure, and teams that understand the structure stop chasing leaderboards.
Benchmarks price the attempt. Production prices the result.
A benchmark score tells you the probability that a model solves a curated task in one attempt under laboratory conditions. Production asks a different question: what does one accepted unit of work cost?
That number includes everything the leaderboard hides:
- Failed attempts and retries. A model that is 10% cheaper per token but fails twice as often on your repository is not cheaper.
- Tool-call overhead. Agentic coding multiplies token spend through file reads, test runs, and search calls. Models differ enormously in how many tool calls they burn to reach the same edit.
- Review time. The most expensive token in the pipeline is the one your senior engineer spends twenty minutes verifying. A model that produces confidently wrong diffs taxes exactly this budget.
- Latency in the loop. For interactive work, a response that arrives in 8 seconds instead of 90 changes how developers use the tool at all.
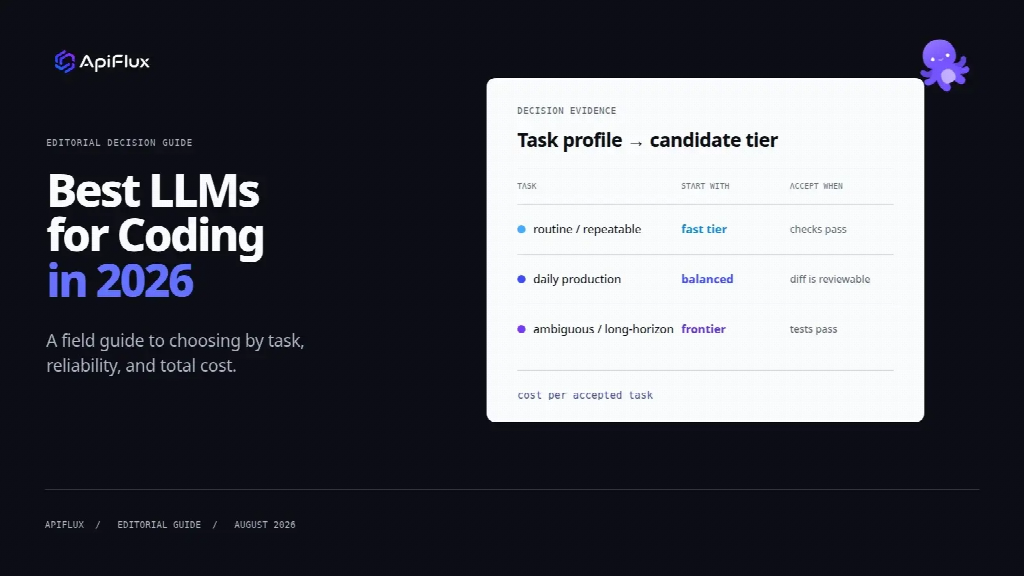
Once you account for these, the single-model question dissolves. A recent task-tiered comparison of coding models (Best LLMs for Coding in 2026) makes the point with public pricing data: the spread between a frontier agent model and a high-throughput one is now more than 40× on output tokens — $50 versus $1.20 per million. No single point on that curve is “best.” The curve is the answer.
The portfolio pattern
The teams getting the most out of coding models in 2026 have converged on the same shape, usually without coordinating:
- A production default for daily features, tests, and code review — chosen for reliability per dollar, not peak capability.
- An escalation tier for repository-scale refactors and long-running agent tasks — expensive, invoked deliberately, measured by whether it saves engineer-days.
- A high-throughput tier for repetitive transforms, migration scripts, and codemod-style work — where per-token price dominates because volume does.
This is ordinary engineering economics — the same logic that gave us instance types instead of one server size. What is new is that model capability and pricing now shift quarterly, which means the portfolio has to be re-evaluated quarterly. A selection that was optimal in March is routinely wrong by August.
The infrastructure consequence
A portfolio approach has an unglamorous prerequisite: switching between models has to be cheap. If every model change means new SDKs, new key management, and a re-write of your tool-calling layer, the evaluation cadence collapses back to “whatever we integrated first.”
This is why the interface layer — not the model — is quietly becoming the durable decision. Teams increasingly standardize on one API surface (most commonly the OpenAI-compatible and Anthropic-native protocols their existing tools already speak) and treat the model behind it as a configuration value. Gateways and routers that hold that surface stable while models rotate behind it turn a quarterly migration project into a config change — and make the failure mode of any single provider a routing event instead of an outage.
Whether a team builds that layer in-house or uses a hosted one matters less than having it. The teams that do are the ones actually running the evaluations everyone else only schedules.
What to measure next quarter
If your team still selects coding models by leaderboard, the fix is one spreadsheet: for two weeks, log every model-assisted task with four fields — model, accepted or rejected, retry count, review minutes. Divide total spend by accepted results. The ranking that falls out will not match the benchmark chart, and the gap between the two is precisely what the leaderboard was costing you.
The “best coding LLM” exists. It is just local to your codebase, your latency budget, and this quarter’s price list — which is exactly why nobody can hand it to you in a chart.