For decades, retail traders have operated at an information disadvantage, often trying to interpret stock price movement without understanding the institutional activity influencing it. As algorithmic trading has assumed a larger role in modern market activity, making sense of stock market data has become increasingly difficult for traders outside the professional environment. Without a structured analytical process, many fall back on emotion based on recommendations, speculation, or isolated trading signals rather than clear analysis and strict risk management.
Martha Stokes, CMT, co-founder of TechniTrader, offers a more informed approach. Drawing on her experience as a Buy-Side Analyst and Chartered Market Technician, she and her team teach traders how to interpret institutional money movement—including chart patterns associated with Dark Pool accumulation and distribution—using TechniTrader’s proprietary Relational Technical Analysis. In this interview, Martha explains how that institutional perspective developed into an educational methodology designed to help self-directed traders analyze the market, control risk, and make independent trading decisions.
Q: You started your first business at age nine and retired in your late 30s. What prompted you to leave retirement behind and establish TechniTrader?
Martha Stokes: Retirement was boring. After I had traveled and done many of the things I wanted to do, I realized something important was missing: purpose. My trading partner, Howard Johnson, suggested that we share our stock market knowledge by creating an educational program for investors and traders. At first, I balked at the idea. I assumed everyone knew what I knew about the market. It took Howard a year to convince me.
At our first workshop in a Seattle hotel, the room was filled with brokers, retail traders, and professionals from many walks of life. I turned to Howard and said, “We are going to have to refund all of these people.” Howard chuckled, as he often did, whispered, “Just do what you do best,” and gently pushed me toward the podium.
The room was packed, without an empty seat. Public speaking comes naturally to me, so I began with the story of how my grandfather introduced me to the stock market when I was a little girl. Then I explained what I had learned about market structure, institutional activity, and how major institutions use dark pools. About ten minutes into my presentation, I stopped, looked around the room, and asked, “You don’t know this stuff, do you?” Every head nodded.
That was the moment I understood how much of the stock market’s structure remained invisible to retail traders. I also realized that Howard and I had knowledge worth passing on. That became TechniTrader. The rest of the story is reflected in more than 50 pages of thank-you letters from our students over the years.
Q: Your background includes working as a Buy-Side Analyst and earning the Chartered Market Technician (CMT) designation. How does that institutional experience influence the training programmes at TechniTrader?
Martha Stokes: My buy-side experience shapes everything we teach at TechniTrader. Much of the stock market education available to retail traders begins with a single trading strategy, indicators or entry signals. I begin with the market participants whose orders can influence price and liquidity, then teach students how to recognize the chart patterns those participants often leave behind.
For example, Buy-side institutions include pension funds, mutual funds, insurance companies, endowments, and asset managers that invest capital on behalf of clients or fund owners. They evaluate companies through fundamentals, industry trends, and emerging technologies, and they tend to build large positions over long periods. Their fiduciary responsibilities and the sheer size of their orders influence how they approach their accumulation of stock shares.
Sell-side firms serve different functions, including brokerage, research, underwriting, trade execution, market making, and proprietary trading. Their incentives and time horizons can differ from those of long-term asset managers.
TechniTrader brings that institutional perspective into technical analysis. We teach students to examine price, volume, Hybrid Leading Indicators, market condition, and institutional-style patterns together. This includes learning to recognize chart evidence of potential Dark Pool activity and to distinguish it from patterns created by other market participant groups. Students can then assess which group appears to be dominant and select trading tactics suited to that environment.
Q: TechniTrader teaches a proprietary methodology called “Relational Technical Analysis.” Could you explain what this is and how it differs from standard chart reading?
Martha Stokes: Relational Technical Analysis is TechniTrader’s method for reading the relationships among price, volume, candlestick patterns, trendlines, support and resistance, and Hybrid Leading Indicators. Standard chart reading often considers an indicator or pattern on its own. I teach students to examine how these elements behave together and what that relationship suggests about the market participant group currently influencing the stock price movement.
TechniTrader classifies 15 market participant groups in today’s stock market. Each group has different objectives, order sizes, time horizons, and trading habits. Those differences can produce recognizable combinations of price action, volume behavior, trend development, and indicator patterns. Relational Technical Analysis helps a trader evaluate who appears to be in control, whether the current price trend is likely to continue, accelerate, reverse, or remain in a consolidation, and which trading style is appropriate for that situation.
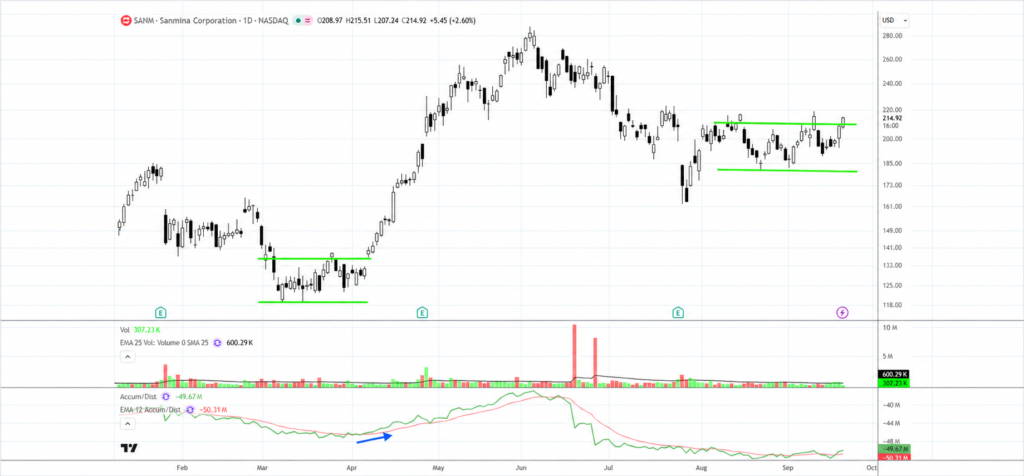
For example, large buy-side institutions often need to accumulate millions of shares without driving the price sharply higher before they finish buying. Quantitative teams often define a narrow execution range and use algorithms such as Time-Weighted Average Price, or TWAP, to spread large order executions over time. On a chart, sustained accumulation may appear as unusually controlled price action within a bottoming or sideways pattern.
I call the area where those relationships suggest institutional accumulation a Dark Pool Buy Zone. It is not a view inside a private trading venue, and it does not identify a specific institution. It is TechniTrader’s analytical designation for a chart area in which price, volume, and indicator relationships are consistent with large-lot accumulation. Learning to recognize these areas can help swing and position traders prepare an entry before a potential momentum move, while still requiring confirmation and a defined risk plan.
Q: A core part of your curriculum involves tracking “Dark Pool” activity. Why is understanding these institutional trades so vital for everyday retail traders?
Martha Stokes: Dark pools are private trading venues, generally operated as Alternative Trading Systems, where orders can be matched without displaying pre-trade quotations on a public exchange. That privacy can help institutions execute large orders with less information leakage and less immediate market impact. Completed dark-pool trades are reported to the consolidated market after execution, but the institution’s identity, full order size, and remaining buying or selling intent are not disclosed. Because the order is executed off-exchange, it does not appear in a public exchange’s pre-trade order book.
In my teaching, I also use the term Dark Pools as shorthand for the giant buy-side institutions that make extensive use of these venues. The distinction matters: a dark pool is the venue, while the institution is the market participant. Retail traders cannot see an institution’s order when it is executed, but they can study end-of-day price and volume activity for patterns consistent with sustained accumulation or distribution.
This activity matters because institutional orders can be large enough to affect liquidity and influence a stock’s longer-term price trend. Through Relational Technical Analysis, I teach students to evaluate the narrow price ranges, volume characteristics, candlestick patterns, and indicator relationships that often develop while institutions build or reduce positions. That perspective helps traders avoid relying on a single indicator or chasing a run after the stock has already moved up too far for a reasonable risk profile.
In TechniTrader’s Methodology Essentials course, students learn how to qualify a potential Dark Pool Buy Zone, determine whether current market conditions support the trade, and plan the entry, stop, and exit before committing capital. The objective is to make a more informed trading decision based on observable chart evidence, disciplined risk management, and also fundamental analysis for certain trading styles.
Q: Many beginners feel overwhelmed by modern algorithmic trading. How do your courses, such as Methodology Essentials, build the practical skills needed to execute a professional trading plan?
Martha Stokes: Modern algorithmic trading has made the stock market faster and more complex. Beginners need a repeatable decision process that slows their own decisions down. The Methodology Essentials training program builds that process step by step: understand the Cycle of Market Participants, identify the current market condition, evaluate whether potential Dark Pool activity or another participant group is influencing price, plan the entry and exit, calculate position size, select the appropriate order, and review the result.
Our approach is individualized rather than a one-size-fits-all trading strategy. We consider each student’s experience, goals, available time, and preferred trading style. Beginners can start with the Standard Edition, students who want more advanced tools can choose the Premier Edition, and those preparing for full-time trading can choose the Elite Edition.
Students practice on a trading simulator so they can develop spatial pattern-recognition skills and learn to follow a professional trading plan without risking capital. We ask them to remain in simulation until they achieve at least a 75 percent success rate under the course rules. A simulated record cannot guarantee the same result in live trading, but it provides evidence that the student can recognize the setup and follow the process consistently before money is at risk.
Students also use our Trade Management Planner to set realistic monthly goals and evaluate the number and quality of trades required to pursue them. Many discover that selectivity matters more than frequency. Waiting for a well-qualified setup can reduce impulsive trades and unnecessary exposure.
We provide Market Condition Analysis scans, trading calculators that reduce position-sizing and order-entry errors, and our proprietary Controlled Bracketed Order process for planning entries, stops, and exits. Regular live Student Mentoring Sessions then give newer students an opportunity to discuss stock analysis and trading decisions with instructors and more experienced traders. Together, these tools turn course concepts into practical habits and teach students how to analyze stocks, control risk, and make independent trading decisions without relying on alerts, tips, or someone else’s trades.
Q: You frequently highlight the importance of “Market Condition Analysis.” How does this concept help traders control risk and avoid buying into temporary market noise?
Martha Stokes: TechniTrader identifies six primary market conditions. Stock behavior, dominant market participants, momentum, and the way support and resistance function can differ in each condition. Defining the current condition helps traders choose tactics suited to the environment, decide how selective to be, and adjust position risk. The result is a daily risk-management framework that reduces reactions to temporary market noise and keeps decisions grounded in broad market evidence.
I originally designed my Market Condition Analysis scans for our trading floor, before TechniTrader became the educational arm of our company. I developed them after recognizing that pre-market futures primarily indicate how the broad market may open. Once trading begins, market direction, momentum, and participation can change.
After the close, when the full day’s data is available, my students and I run seven scans in the same sequence: Momentum Buy, Momentum Sell, Institutional, Bottoming, Consolidating, Overbought, and RSI Strength. Comparing the Momentum Buy and Momentum Sell scans helps me evaluate market energy and directional bias. The Institutional and Bottoming scans show how broadly patterns associated with long-term accumulation and potential Dark Pool activity are appearing among individual stocks. Consolidating identifies the types of controlled patterns often used by independent professional traders. Overbought warns when more stocks are becoming vulnerable to a turn, especially when downside momentum is also increasing. RSI Strength measures how broadly prices have improved during the recent trading month. Together, the seven scans help students judge whether the broader market environment supports a trade in an individual stock displaying a potential Dark Pool Buy Zone.
No single scan can predict the next trading day with certainty. The value comes from comparing all seven to see whether momentum, institutional activity, and broader market participation confirm or contradict one another. That combined evidence helps me assess the market’s probable direction and strength after the opening activity settles and determine whether risk is expanding or contracting. I publish two market reports each trading day, one before the open and one after the close, to help students recognize directional changes, accelerating or weakening momentum, and developing reversal risk.
The insights shared by Martha Stokes highlight a practical shift in how retail traders can approach the stock market. By adopting a structured method that tracks institutional footprints—including potential Dark Pool activity—traders gain more context for interpreting price movement and evaluating opportunities. TechniTrader’s comprehensive education combines Relational Technical Analysis, Market Condition Analysis, risk management, and fundamental analysis where appropriate, helping students develop the discipline required to make informed trading decisions independently.
As market structure continues to change under the influence of algorithmic trading, data-driven education becomes increasingly important. Understanding how different market participant groups influence stock prices helps self-directed traders interpret what is happening and respond without being driven by temporary market noise. TechniTrader gives independent investors the analytical tools, guided practice, and decision-making framework needed to manage risk and adapt as market conditions change.
To learn more, visit https://www.technitrader.com/