During my career leading large-scale engineering platforms, I’ve learned that the most expensive failures are rarely the ones that happen suddenly. Not the dramatic outage — the one where alarms fire at 2 a.m. and the entire team mobilizes. Those are painful, but they are visible. The crisis I am describing is quieter. It builds over months, accumulates in places nobody is watching, and announces itself only when it is already expensive to fix.
It looks like this: a microservice that was clean eighteen months ago now has forty-seven downstream dependencies. A team that used to own three services now nominally owns eleven, with real attention on two. Deployment failure rates that were 4% last quarter are 14% this quarter, and nobody can point to a single change that caused the shift. The architecture has been degrading the entire time. The organization found out when it started breaking.
This is the problem that a new class of AI-driven monitoring framework is beginning to solve — and the timeline it is providing to engineering teams is more specific than most leaders expect. For large engineering organizations, architectural degradation is more than a technical problem. It increases release delays, operational costs, and engineering effort. Teams often spend weeks addressing issues that could have been detected months earlier if the right signals had been monitored.
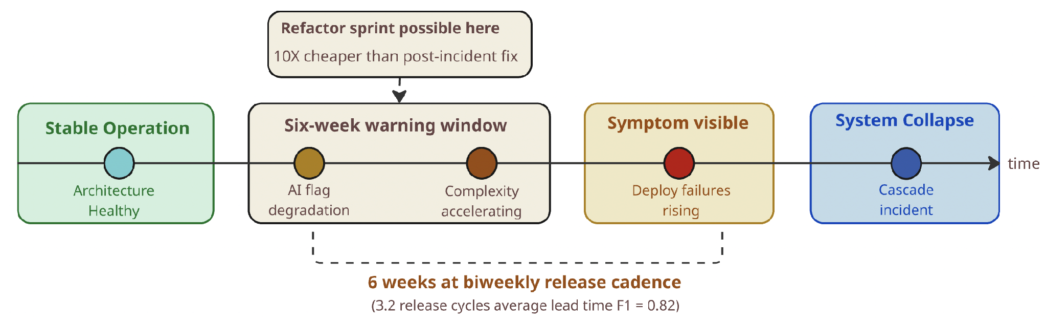
Fig. 1: The six-week warning — AI detects architectural degradation 3.2 release cycles before deployment failures become visible in standard dashboards.
The finding is based on evaluation across three open-source microservice systems containing between 8 and 41 services, using multi-year Git histories and operational telemetry.
The Problem with Watching the Present
Modern engineering organizations have invested heavily in observability. Distributed tracing, log aggregation, real-time dashboards, SLO monitoring — the tooling available today would have seemed extraordinary a decade ago. And yet most of it watches the present. It tells you what is happening right now: this service is slow, that deployment failed, this endpoint is throwing errors.
What it does not tell you is what is about to happen — specifically, that the architecture your team is building on top of is accumulating structural debt that will make the next quarter significantly more expensive than the last one.
The gap exists because architectural health has traditionally been treated as a periodic concern. Organizations schedule quarterly architecture reviews. They commission annual refactoring sprints. They bring in consultants to assess the system state. All of these practices share the same fundamental limitation: they analyze a snapshot. They tell you what the architecture looks like today, not where it is heading or how fast it is getting there.
Microservice systems do not stand still long enough for snapshots to be useful. A system releasing multiple times per week accumulates meaningful structural change between any two review points. By the time the quarterly review happens, the dependency graph may have grown by dozens of edges. Services that were loosely coupled may have drifted into tight coupling. The review becomes a retrospective on damage rather than prevention of it.
What AI Changes About This Picture
The core insight behind AI-driven architecture monitoring: architectural degradation leaves measurable signals before it produces system failures. If you can extract those signals continuously and model their trajectory, you can predict where the architecture is heading — not after the fact, but weeks in advance.
In my research developing ArchTrace-AI, I investigated whether machine learning models could detect degradation signals hidden within engineering and operational data before they became operationally visible.
Tested across three open-source microservice benchmarks — systems ranging from eight to forty-one services with multi-year Git histories — the AI model detected signals of architectural degradation an average of 3.2 release cycles before that degradation became measurable in deployment failure rates and operational metrics.
For a team releasing biweekly, 3.2 release cycles is approximately six weeks. That is the six-week warning. Six weeks is enough time to run a targeted refactoring sprint, to reassign ownership of an underserved service before it becomes a single point of failure, or to stop adding features to a subsystem the model has flagged as structurally overloaded. It is not enough time to do any of those things after deployment failures have already begun climbing.
What the AI Is Actually Reading
Imagine a service that had five dependencies last year and now has twenty. Nothing may appear wrong today, but the system is becoming increasingly difficult to change. This type of structural trend is exactly what AI models monitor.
Understanding why this works requires understanding what signals the model uses. This is where ArchTrace-AI diverges from what you’d expect. The natural assumption is that architectural health should be predicted from the code itself — code quality metrics, complexity scores, test coverage. The framework takes a different approach. Instead of examining architecture as a snapshot in time, it analyzes how the architecture has evolved over months or years.
The model ingests four data sources that most engineering organizations already produce: Git repository commit history, CI/CD deployment logs, service registry snapshots, and repository ownership metadata. From these inputs, the model computes three metrics that do not exist in standard observability tooling.
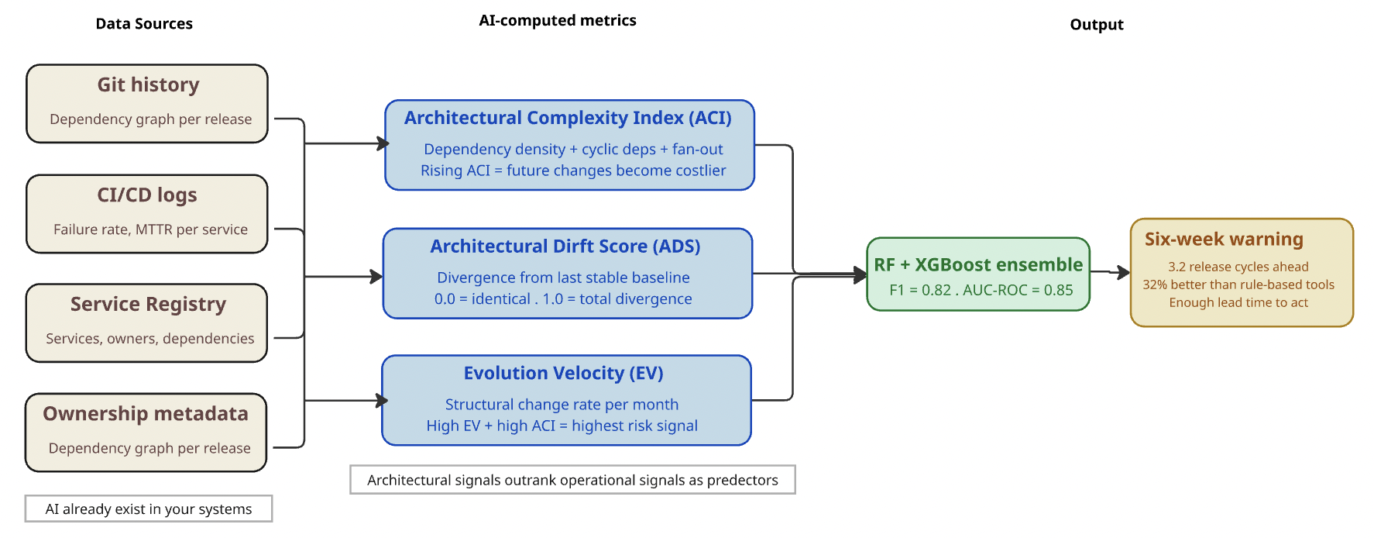
Fig. 2: ArchTrace-AI signal flow — four existing data sources feed three novel AI-computed metrics into an ensemble model producing the six-week warning.
The Architecture Complexity Index combines dependency density, cyclic dependency rate, and fan-out into a single scalar that tracks how structurally complicated the system is becoming over time. A rising ACI does not mean the system is broken today. It means the system is becoming harder to change — which means future changes will be more expensive, more error-prone, and more likely to cascade.
The Architecture Drift Score measures how far the current structure has diverged from the most recent stable baseline. A system can drift significantly without triggering any alert in standard monitoring tools. The drift score makes that divergence visible and quantifiable. The Evolution Velocity captures how fast the structure is changing — not whether individual changes are good or bad, but whether the rate of change itself is sustainable. High velocity combined with rising complexity is the strongest joint predictor of impending degradation in the analysis.
The Signal Nobody Expected
One of the most interesting findings was which signals contributed most to predictive accuracy. The initial expectation was that operational metrics would dominate. Deployment failure rates and recovery times feel intuitively close to architectural health — systems that are hard to change produce more deployment failures, so those failures should be early warnings.
The data said otherwise.
Architectural signals consistently outranked operational signals in feature importance. Dependency growth rate, ownership concentration, and the composite complexity index all ranked above deployment frequency and recovery time as predictors of future degradation.
This creates the predictive window. If you can see the architectural signals, you see the problem before the operational symptoms arrive. If you wait for the operational symptoms, you have already consumed most of your lead time.
What This Looks Like in Practice
Consider a concrete scenario that this type of monitoring framework is designed to catch. A product team is moving fast. They are shipping twice a week, hitting their feature targets, keeping deployment failure rates under control. The dashboards are clean. But the Git history tells a different story: the service they own has gone from four dependencies to nineteen over eight months. Three of those dependency edges are circular. The team’s ownership of the service — previously concentrated in two primary contributors — has diffused across eleven people, none of whom has made more than two commits to the configuration layer in the past quarter. Standard monitoring sees none of this. The service is up. Latency is acceptable. Error rates are within SLO.
The proposed framework sees it clearly. The dependency growth rate is accelerating. The complexity index has crossed the 90th percentile for this system’s historical distribution. The model flags the service as high risk for architectural degradation within the next three to four release cycles. Six weeks later, a change that would have been routine in a less entangled system causes a cascade. Four services that depend on the flagged one behave unexpectedly. The deployment failure rate spikes. The team spends two weeks in remediation mode instead of building features.
The Question of Ownership Concentration
Of the signals this research identified, ownership concentration is worth dwelling on — it’s the one most leaders overlook, and the one most immediately within their control. Standard engineering metrics measure code quality, test coverage, build times, deployment frequency. None of them measure how well a service is understood by the people responsible for it. Ownership concentration is a proxy for that understanding.
A service where one or two engineers have made 80% of the meaningful configuration changes over the past six months is a service where institutional knowledge is concentrated. If those engineers leave, get promoted, or shift focus to another project, the service becomes effectively unmaintained — even if it has twenty nominal owners in the registry.
Ownership concentration ranked second only to dependency growth rate in predictive importance across all signals tested. Measuring this does not require new tooling. Git history already contains this information. What has been missing is a practical way to extract it systematically and use it as an early indicator of architectural risk.
What Engineering Leaders Should Take from This
Three implications follow from this research that are immediately relevant to engineering organizations managing microservice portfolios.
- Monitor dependency growth trends monthly.
- Track ownership concentration for critical services.
- Treat architectural health as a continuous metric rather than a quarterly review activity.
A note on limitations. Predictive architecture monitoring is still an emerging discipline. The evaluation in this research used open-source microservice benchmarks; results on proprietary enterprise systems may differ. No AI model can replace experienced architects or engineering leaders. These frameworks should be treated as early-warning instruments that sharpen human judgment, not substitute for it.
Architectural health needs a continuous signal, not a periodic one. Quarterly reviews are not capable of detecting the rate of change at which modern microservice systems evolve. The six-week warning is only available if someone is measuring the right things continuously. Organizations that review architecture annually are measuring it at one-eighth the frequency needed to use that lead time.
The signals you need are already in your systems. Git history, CI/CD logs, service registries — every engineering organization above a minimal scale produces these artifacts. The gap is not data collection. It is the analytical layer that connects them into a coherent trajectory signal.
Ownership is a leading indicator. If there is one metric from this research worth adding to an existing engineering dashboard without building anything sophisticated, it is ownership concentration. Tracking how contributor activity is distributed across services — and flagging services where that distribution is becoming dangerously diffuse — is achievable with modest data engineering and provides a meaningful early warning signal on its own.
The Longer Arc
Organizations already spend heavily on observability, incident response, and operational monitoring. Predictive architecture monitoring represents the next logical step: identifying risk before customers, engineers, or business stakeholders experience the consequences. The tools that implement it at production scale for large enterprise portfolios are still maturing, and this research represents an early but concrete step toward establishing the discipline on a rigorous empirical foundation.
What is already clear is that these signals exist and can often be observed before operational problems become visible. Architectural degradation leaves measurable traces in the data organizations already produce, weeks before those traces become operational failures.
The six-week warning is not guaranteed. It is an average drawn from specific systems and model configurations. In practice, the lead time will vary. The specific number matters less than what it implies: architectural problems rarely appear overnight. Organizations that monitor the right signals early gain something increasingly valuable in software engineering — time to act before the damage is done.
About the author
Hemanta K. is an Engineering Manager at Best Buy USA and an independent researcher in machine learning and data engineering. His work focuses on applying AI to software reliability, distributed systems, architectural governance, and engineering productivity. His current research includes ArchTrace-AI, a framework for predictive microservice architectural health monitoring, and SchemaSentinel, a framework for detecting drift in structured LLM outputs.