Managing a farm fleet requires more than knowing where tractors, trucks, combines, and utility vehicles are located. Owners and fleet managers also need clear data showing how often equipment is used, whether it is operating efficiently, and where unnecessary costs may be developing. Monitoring farm fleet utilization metrics helps agricultural businesses make better decisions about scheduling, maintenance, fuel use, labor, and future equipment purchases. With farm equipment GPS tracking, many of these measurements can be collected automatically instead of relying on handwritten logs or operator estimates. The right metrics give managers a clearer picture of whether each machine is contributing enough value to justify its operating and ownership costs.
Why Farm Fleet Utilization Matters
Farm equipment is a major investment, and underused machinery can tie up capital that could be directed toward other areas of the operation. At the same time, equipment that is used too heavily may experience faster wear, more frequent breakdowns, and costly interruptions during planting or harvest. Tracking utilization helps farms maintain a healthier balance between equipment availability and actual operational demand. It can also reveal whether several machines are performing overlapping roles or whether certain assets are consistently unavailable when needed. These insights allow owners to make decisions based on measurable performance instead of assumptions.
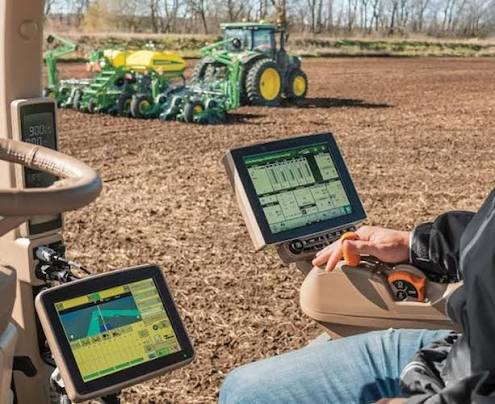
Utilization data is especially important for farms with equipment spread across multiple properties or managed by several crews. Without a centralized system, managers may not know which tractor is operating, which vehicle is sitting idle, or whether a machine has been moved to another field. This lack of visibility can lead to duplicate equipment rentals, unnecessary purchases, and wasted labor. Farm equipment GPS tracking can bring location, activity, and engine data into a single platform. Managers can then compare machine performance across different locations, operators, and seasons.
Total Engine Hours
Total engine hours are among the most basic and valuable farm fleet utilization metrics. This measurement shows how long a machine’s engine has been running during a specific period, such as a day, week, month, or growing season. Engine-hour data helps managers compare the actual use of similar machines and identify equipment that may be significantly underused. It also supports more accurate maintenance scheduling because many agricultural machines require service after a set number of operating hours. Using real data reduces the risk of performing maintenance too early or missing a critical service interval.
Engine hours should be reviewed alongside the work completed by each asset. A machine with high engine hours may appear productive, but those hours could include excessive idling or inefficient travel. Conversely, a specialized machine may record relatively few hours while still providing essential value during a short seasonal window. Managers should therefore avoid evaluating utilization based on engine time alone. Instead, engine hours should be combined with productivity, idle time, fuel use, and task-specific measurements.
Active Working Time
Active working time measures how long equipment is performing productive tasks rather than simply running. Depending on the tracking system, this may be determined through speed, location, power take-off activity, hydraulic use, or other equipment signals. For example, a tractor moving steadily within a field may be classified as active, while the same tractor parked with the engine running would be classified as idle. This distinction allows managers to understand how much of the equipment’s operating time is actually contributing to farm work. Higher active-use percentages generally indicate better scheduling and stronger asset productivity.
Managers can use active working time to compare machines assigned to similar jobs. If one tractor completes a comparable field task with significantly less active time, differences in operator habits, equipment condition, route planning, or machine capability may be involved. This information can guide training, maintenance, and equipment assignment decisions. It may also show that a newer or more appropriately sized machine can complete work more efficiently. Over time, active-use data helps farms establish realistic performance benchmarks for common operations.
Idle Time
Idle time refers to periods when a machine’s engine is running, but the equipment is not completing productive work. Some idling is unavoidable, especially during loading, unloading, operator transitions, warm-up periods, or field coordination. However, excessive idling increases fuel consumption, engine wear, emissions, and maintenance costs without increasing output. Farm equipment GPS tracking can automatically identify extended idle periods and show where and when they occurred. Managers can then determine whether the idling was operationally necessary or the result of avoidable habits.
Reducing idle time can produce meaningful savings across a large fleet. Even small improvements become significant when multiplied across several tractors, trucks, and utility vehicles over an entire season. Useful strategies may include improving crew coordination, adjusting staging areas, shutting down equipment during long delays, and reviewing operator procedures. Alerts can also be configured when a vehicle idles longer than an approved limit. These notifications encourage faster intervention and help establish more efficient operating habits.
Equipment Utilization Rate
Equipment utilization rate shows the percentage of available time that a machine is actively being used. A simple calculation divides actual productive hours by the total hours the equipment was available for operation. For example, if a tractor was available for 100 hours during a reporting period but worked for 60 hours, its utilization rate would be 60 percent. This metric is useful for identifying machines that are regularly in demand and those that spend most of their time parked. It also helps managers evaluate whether the fleet is appropriately sized.
A low utilization rate does not always mean an asset is unnecessary. Certain machines, such as combines, sprayers, and specialized harvest equipment, may only be needed during limited periods. Their value may depend on being available at exactly the right time rather than operating throughout the year. Managers should compare utilization against the purpose, seasonality, ownership cost, and replacement difficulty of each machine. Asset-specific expectations provide a more accurate analysis than applying the same target to every piece of equipment.
Distance Traveled and Route Efficiency
Distance traveled provides insight into how much time and fuel equipment spends moving between fields, barns, storage areas, and service locations. Excessive travel may indicate poor equipment staging, inefficient assignments, or unnecessary trips between properties. GPS data can reveal repeated routes, long detours, and movement patterns that may not be visible through engine-hour reports. Managers can use this information to position machines closer to planned work and improve daily dispatching. Better route planning can reduce fuel use and increase the number of productive hours available.
Route efficiency is particularly important for farm trucks, service vehicles, fuel tenders, and equipment transport units. These vehicles may cover substantial distances while supporting field operations, delivering supplies, or moving machinery. Comparing planned routes with actual routes can reveal delays, unauthorized use, or inefficient scheduling. Farms with several locations may also identify opportunities to group tasks in the same geographic area. Reducing unnecessary travel lowers costs while improving crew productivity and response times.
Fuel Consumption and Fuel Efficiency
Fuel consumption is one of the most important operating costs associated with agricultural equipment. Monitoring fuel use by asset helps managers identify machines that consume more fuel than expected for the work being performed. Sudden increases may point to mechanical problems, excessive idling, fuel theft, heavy loads, or inefficient operator behavior. When fuel data is combined with engine hours and completed work, farms can calculate more meaningful efficiency measurements. Examples include fuel used per acre, per operating hour, per mile, or per completed task.
Useful fuel-related metrics include:
- Total fuel consumed by each machine
- Fuel cost per engine hour
- Fuel consumed per acre worked
- Fuel used during idle periods
- Fuel efficiency by operator
- Unexpected fuel-level decreases
- Fuel consumption compared with historical averages
These measurements allow farms to identify both equipment and operational issues. A tractor that consistently uses more fuel than similar machines may need inspection, maintenance, or a different assignment. Operator training may also improve fuel efficiency by reducing harsh acceleration, excessive speed, and unnecessary idling. Reliable fuel data can support more accurate budgets for future seasons.
Maintenance Costs and Downtime
Maintenance costs should be monitored for each machine rather than viewed only as a fleet-wide expense. Tracking labor, parts, fluids, tires, service calls, and repair costs helps managers understand the true cost of keeping an asset operational. A machine with moderate utilization but unusually high repair expenses may no longer be economically efficient. By contrast, an older machine with low ownership costs and reliable performance may still deliver strong value. Maintenance cost per operating hour is often more useful than total maintenance cost alone.
Downtime measures how long equipment is unavailable because of maintenance, repairs, inspections, or parts delays. High downtime can disrupt field schedules and force managers to rent equipment or transfer machines from other locations. Monitoring downtime helps identify recurring mechanical problems and assets that may be approaching the end of their useful life. It also allows managers to compare the reliability of different makes, models, and equipment classes. Preventive maintenance planning can then be adjusted to reduce breakdowns during critical work periods.
Cost Per Operating Hour
Cost per operating hour combines multiple expenses into a single performance metric. The calculation may include fuel, maintenance, repairs, insurance, depreciation, financing, labor, and other ownership costs. This figure helps managers compare machines that perform similar functions and determine which assets deliver the best overall value. A machine with a high purchase price may still have a competitive hourly cost if it operates efficiently and requires limited maintenance. An older machine may appear inexpensive, but become costly when repair expenses and downtime are included.
Cost per operating hour is also valuable when deciding whether to buy, lease, rent, or contract out certain work. If a specialized piece of equipment is used for only a few hours each year, renting or hiring a custom operator may be more economical. On the other hand, high utilization may justify ownership even when the initial purchase cost is substantial. Managers should calculate this metric using consistent categories and realistic annual usage. Reviewing it at least once per season can reveal changing equipment economics.
Acres or Tasks Completed
Productivity metrics connect equipment use to the actual work completed. Depending on the type of operation, farms may track acres planted, acres harvested, loads hauled, bales produced, applications completed, or hours spent on a specific task. These measurements show whether high engine hours are translating into meaningful output. They also provide a basis for comparing different machines and operators under similar conditions. Productivity data is most useful when field size, terrain, weather, crop type, and equipment configuration are considered.
Common productivity measurements may include:
- Acres completed per hour
- Loads moved per day
- Bales produced per operating hour
- Fuel used per completed acre
- Time required per field
- Tasks completed per shift
- Output per operator
- Percentage of scheduled work completed on time
Farm equipment GPS tracking can help automate some of these calculations by matching equipment movement with mapped field boundaries. Managers can see when machines entered and exited specific fields and how long each job required. Comparing this information across seasons helps establish realistic schedules and labor needs. It can also support more accurate bidding for custom farming services.
Operator Performance and Equipment Use
Operator behavior can have a major impact on equipment utilization, fuel consumption, maintenance, and safety. GPS and telematics systems may record speeding, harsh braking, rapid acceleration, long idle periods, unauthorized use, and operation outside approved areas. These measurements should be used to improve consistency and safety rather than simply penalize employees. Clear policies and transparent communication help operators understand how data will be reviewed. Training can then focus on specific behaviors that increase costs or equipment wear.
Operator performance data may also reveal positive results. Some employees may consistently complete tasks with lower fuel use, less idle time, and fewer mechanical issues. Their techniques can be used to develop best practices for the rest of the team. Managers should account for job difficulty, equipment type, field conditions, and workload when comparing operators. Fair evaluation requires context, not just raw numbers.
Frequently Asked Questions
What is farm fleet utilization?
Farm fleet utilization measures how effectively tractors, vehicles, and other equipment are being used compared with their availability, cost, and intended purpose.
What is the most important utilization metric?
There is no single best metric. Active working time, idle time, cost per hour, productivity, and downtime should be reviewed together.
How often should fleet metrics be reviewed?
Basic data can be reviewed weekly, while detailed performance and cost reports may be evaluated monthly, seasonally, or annually.
Can GPS tracking measure equipment productivity?
Yes. GPS systems can track location, movement, engine hours, field time, routes, and other data that support productivity analysis.
Does low utilization mean equipment should be sold?
Not necessarily. Seasonal or specialized equipment may have low annual use but still be essential during critical operating periods.
How can farms reduce equipment idle time?
Farms can improve scheduling, stage equipment closer to work areas, coordinate crews more effectively, and use alerts for extended idling.
Can utilization data help with equipment purchasing?
Yes. Historical usage, cost, productivity, and downtime data can show whether a new purchase is justified or whether renting may be more practical.
Turn Fleet Data Into Better Farm Decisions
Tracking data only creates value when it is reviewed and used to guide decisions. Farms should choose a manageable set of farm fleet utilization metrics that reflect their most important operational and financial goals. Engine hours, active work time, idle time, fuel efficiency, downtime, cost per hour, and completed work provide a strong starting point. Farm equipment GPS tracking can automate much of this data collection and give managers a consistent view of equipment performance across multiple fields and locations. By monitoring these metrics over time, agricultural businesses can reduce waste, improve maintenance planning, control operating costs, and get more value from every machine in the fleet.