
The Pothole Is Becoming a Data Point: How Computer Vision Is Turning Ordinary Vehicles

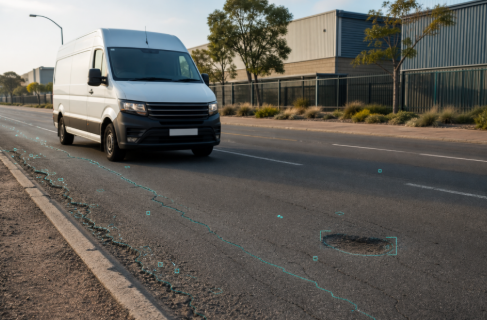
A delivery van rolls over a fraying stretch of road edge on an ordinary Tuesday morning. Nothing happens, as far as the driver is concerned — no bump worth mentioning, no reason to slow down. But the van’s forward-facing camera has already logged the crack pattern, frame by frame, timestamped and geotagged, before the vehicle is a block away. Nobody in the cab notices. Nobody needs to.
Multiply that single unremarkable moment by every camera-equipped vehicle currently on the road — delivery fleets, rideshare cars, ordinary commuters running a dashcam for insurance purposes — and something changes. A road surface that has always failed slowly and invisibly, one that only became “known” when someone hit a pothole hard enough to complain about it, is quietly becoming something else: measurable, continuously, at almost no marginal cost. The pothole is becoming a data point.
From potholes to pixels: how machines read a road surface
The detection layer behind this shift is not exotic. Dashcams, fleet telematics cameras and even ordinary smartphones can feed computer-vision models trained to recognise the visual signatures of surface distress — cracking, ravelling, rutting, potholing — the same way a trained inspector would, just without the inspector.
What once required a dedicated survey vehicle, driven on a fixed schedule by a specialist crew, now rides along on hardware that was already deployed for an entirely different reason. Systems built by vendors such as Vaisala’s RoadAI have shown that footage collected incidentally, at highway speed, from vehicles going about their normal business, can be classified into usable condition data with enough consistency to matter operationally. What changes here is mostly economic: sensing stops being a discrete, budgeted survey event and becomes a background process running continuously across an entire network.
The invisible asset becomes queryable
Individual detections, taken alone, are just observations. Aggregated across thousands of passes, they become something closer to a live database: a road network with condition scores attached to specific segments, updated on a rolling basis, with time-series trends a manager can actually watch.
That distinction matters more than it sounds. A condition score recorded once tells you where a road stands today. A condition score recorded repeatedly tells you the rate at which it is deteriorating — which is the number that actually drives budgeting decisions. Recent pilot work summarised by the US Department of Transportation’s ITS program illustrates where this is heading: agencies are moving from periodic manual surveys toward continuous, vehicle-sourced condition monitoring as a standing input to maintenance planning, not a special project. Peer-reviewed engineering research is following the same path, treating crowd-sourced visual data as a legitimate input alongside traditional pavement management systems rather than a novelty.
Why a data point is only half the story
Here is the part the sensing conversation tends to skip. Detection is not repair. A camera can flag a crack pattern consistent with base failure; it cannot commission a contractor, size the job, or produce a number a property or road owner can actually budget against.
That gap — between “we now know this surface is failing” and “we have priced what fixing it will cost” — is where the sensing story meets a decision. And the single biggest variable in that decision is usually not visible from above at all: it is the condition of the layer beneath the surface, the base and drainage the camera can only infer from the cracking pattern it sees on top. That is precisely why asset owners increasingly want to sanity-check a number before committing to it — tools built to benchmark realistic tar-surfacing costs per square metre, using South Africa’s market as a working example, exist for exactly this reason: to give someone a defensible range before a single contractor sets foot on site.
What “priced” looks like on the ground
Once a flagged defect crosses that bridge, it becomes a real job with a real scope: a pothole or patch repair, a stretch of crack sealing, base preparation and drainage correction, or in worse cases a full resurfacing. None of those jobs price themselves the same way. A small patch job is dominated by access and bond preparation; a full resurfacing is dominated by how much of the existing base has to be rebuilt before a new surface can go down at all.
The cleaner the condition data feeding into that scoping conversation, the tighter the eventual quote — and the fewer surprises once work actually starts. An owner who can point to where and how severely a surface has degraded, rather than describing it from memory, gives a contractor far less room to pad a number for uncertainty. Detection quality and pricing accuracy are, in that sense, directly linked.

A live condition layer meets a live pricing layer
Two previously separate data layers are converging. On one side, continuous, vehicle-sourced condition sensing is turning physical infrastructure into something closer to a monitored asset than a static one. On the other, cost benchmarking is becoming more transparent, giving owners a realistic sense of what a repair should cost before they ever request a quote.
Put those two layers together and where this is headed becomes hard to miss: away from reactive, emergency-driven road maintenance and toward something closer to proactive, budgeted asset management — where a deteriorating surface is caught, priced and scheduled long before it becomes a genuine hazard or an emergency expense.
Watching it coming
Back to the van from this morning. The crack pattern it logged without anyone noticing is now a row in a dataset, a maintenance flag on a segment map, and — before long — a priced decision waiting for someone to approve it. The pothole was always there. What has changed is that, for the first time, we can watch it coming.







Comment