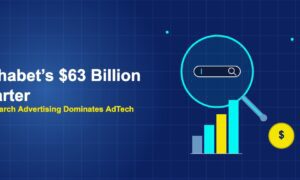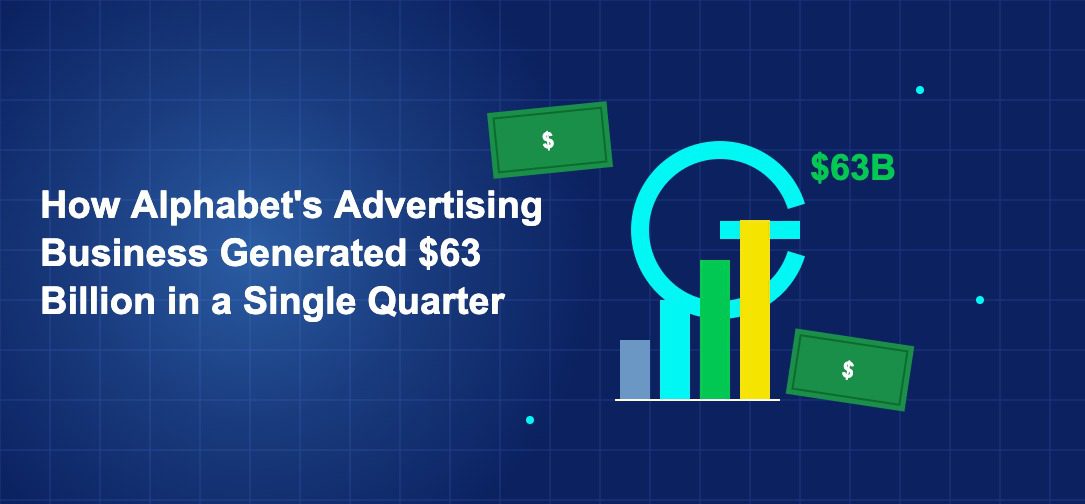
Alphabet’s advertising business generated $63.1 billion in the most recent quarter, representing 17% year-over-year growth and marking the highest quarterly advertising revenue ever reported by the company. That result reflects strength across all of Alphabet’s advertising channels and the company’s ability to maintain pricing power despite regulatory scrutiny and competitive pressure. Breaking down the $63.1 billion reveals the drivers of that performance and what it signals about the health of the digital advertising market.
The 17% year-over-year growth is significant in two ways. First, it is growth on a very large base. A company generating $53.8 billion in quarterly revenue one year earlier would typically be expected to grow more slowly than a smaller company. The fact that Alphabet accelerated to 17% growth despite that size suggests underlying demand is strong. Second, 17% growth is faster than the growth of the overall digital advertising market, which is growing roughly 10-12% annually. That outperformance suggests Alphabet is gaining market share even at its enormous size.
That market share gain is driven by several factors. First, artificial intelligence has become a competitive advantage for Alphabet. Google’s Performance Max campaign format, powered by machine learning, has become increasingly popular with advertisers because it delivers better results with less manual optimization. Advertisers report 10-20% improvement in ROI when using Performance Max compared to manual campaign management. That improvement has driven adoption, which has driven spending growth.
Second, Alphabet has successfully integrated AI across all advertising products. Google Search Ads now use AI to optimize keyword bidding in real time. YouTube uses AI to match ads to videos and viewers most likely to engage. Google Display Network uses AI for audience targeting. That pervasive use of AI is improving performance across the board, which is driving advertiser satisfaction and increased spending.
Third, Alphabet has benefited from consolidation of advertiser budgets. As smaller platforms struggle, advertisers are pulling budgets from those platforms and allocating them to Alphabet. That consolidation is visible in the growth rates. Alphabet’s advertising growth is faster than TikTok’s, faster than Snapchat’s, faster than Twitter’s. Each point of share lost by competitors is a point of share gained by Alphabet.
Breaking down the $63.1 billion by advertising channel provides insight into the composition of Alphabet’s advertising revenue. Search advertising accounts for roughly 60% of total advertising revenue, translating to approximately $37-38 billion per quarter. That channel grew roughly 14% year-over-year. YouTube advertising accounts for roughly 30% of revenue, translating to approximately $19-20 billion per quarter. That channel grew roughly 20% year-over-year. Network advertising, including display and other formats, accounts for roughly 10% of revenue, translating to approximately $6-7 billion per quarter. That channel grew roughly 7% year-over-year.
The divergence in growth rates across channels is important. YouTube is growing faster than search. That shift reflects advertiser appetite for video advertising and Alphabet’s success in monetizing YouTube’s vast user base and video library. Video advertising commands higher CPMs than display advertising because it has higher engagement rates and better ROI. The shift toward video is a positive development for Alphabet’s margins and pricing power.
Search advertising’s 14% growth is solid but slower than historical rates. That slowdown reflects market maturation in the US, where most of the search volume and the highest CPMs are concentrated. Growth in search advertising is increasingly coming from international markets like India and Southeast Asia, where CPMs are lower but growth is faster. That geographic shift means search advertising growth will likely moderate from the 14% rate achieved in recent quarters.
Network advertising’s slower growth reflects long-term structural headwinds. Publishers are shifting away from third-party networks and building first-party relationships with advertisers. That shift concentrates ad inventory in owned media platforms rather than open networks. Google’s network business is also affected by cookie deprecation, which has reduced the precision of targeting on third-party sites. That loss of precision has reduced advertiser demand for network inventory, putting downward pressure on pricing and volume.
Geographic breakdown of the $63.1 billion reveals the importance of the US market. The US accounts for roughly 50% of Alphabet’s advertising revenue, translating to approximately $31-32 billion per quarter. The US market is also where advertisers spend the most per user and where competition for premium inventory is most intense. The EU accounts for roughly 20% of revenue, translating to approximately $12-13 billion per quarter. The rest of world accounts for roughly 30%, translating to approximately $19-20 billion per quarter.
The rest of world segment is growing faster than the US. While the US grew approximately 12% year-over-year, the rest of world grew approximately 22%. That faster growth reflects the maturation of digital advertising in India, Southeast Asia, and Latin America. As those markets develop, advertisers in those regions spend more on digital advertising, and Alphabet’s global presence allows it to capture that growth. That geographic diversification is important for long-term growth because the US market is largely saturated.
Advertiser vertical concentration in the $63.1 billion is also significant. Technology companies (including software-as-a-service providers and consumer electronics companies) account for roughly 20% of Alphabet’s advertising revenue, translating to roughly $12-13 billion per quarter. E-commerce retailers account for roughly 18%, or roughly $11-12 billion per quarter. Financial services companies account for roughly 12%, or roughly $7-8 billion per quarter. The remaining 50% is distributed across healthcare, automotive, travel, and other verticals.
That vertical concentration creates both opportunity and risk. Technology companies, particularly software companies, have strong demand for search advertising because they need to acquire customers and maintain high CAC (customer acquisition cost) targets. As long as those companies are investing in growth, they will continue to spend on advertising. But if economic growth slows and those companies reduce spending, Alphabet’s revenue would face significant headwinds.
The $63.1 billion quarterly result also reflects strong desktop and mobile split. Search advertising on mobile accounts for roughly 65% of search revenue, reflecting the shift to mobile usage. YouTube, which is consumed heavily on mobile, is also growing faster on mobile than on desktop. That mobile concentration is expected to continue as global internet usage is increasingly mobile-first. For Alphabet, the shift to mobile has required investment in mobile advertising infrastructure but has also created opportunities for higher-engagement ad formats that perform better on mobile.
Automation and AI are also driving CPM increases. Google’s bidding algorithms have improved in their ability to identify high-value placements and adjust bids accordingly. Advertisers using automated bidding report cost per acquisition (CPA) improvements of 10-20% compared to manual bidding. Those improvements have driven adoption of automated bidding, which concentrates spending with Google because Google’s algorithms are more sophisticated than competitors’.
Performance Max, Google’s newest campaign format combining search, display, video, and shopping ads into a single AI-managed campaign, is driving disproportionate growth. Advertisers report better performance with Performance Max than with traditional search-only or display-only campaigns. Adoption of Performance Max has been rising, with some estimates suggesting 20-30% of Google Search volume now comes through Performance Max campaigns. That shift is important because it increases the complexity and lock-in of Google’s systems.
Looking forward, Alphabet’s quarterly advertising revenue is projected to reach $66-68 billion by Q4 2026. That projection assumes continued 12-15% year-over-year growth driven by international market expansion, AI-powered optimization improvements, and YouTube monetization improvements. The risk to that projection comes from economic recession, regulatory action that constrains data collection, or loss of search dominance. Those risks are real but are not reflected in current financial performance.
Alphabet’s $63.1 billion in quarterly advertising revenue reflects strength across search, YouTube, and network channels, with growth driven by AI-powered optimization improvements, international market expansion, and consolidation of advertiser budgets from smaller competitors.