Fairness metrics in machine learning have moved from research papers into supervisory expectations in U.S. finance over the past two years. The CFPB, the Federal Reserve, and the OCC have all addressed model fairness in published guidance, and the practical question for U.S. financial institutions is no longer whether to measure fairness but how to measure it well, which metrics to prioritise, and how to integrate fairness analysis into model development without slowing it to a halt.
This piece looks at where fairness metrics for machine learning have settled in U.S. finance in 2026, the metrics that have proven most useful, the trade-offs that fairness analysis cannot eliminate, and the operational disciplines that turn fairness measurement into model improvement rather than only into compliance documentation.
The metrics that have actually proven useful
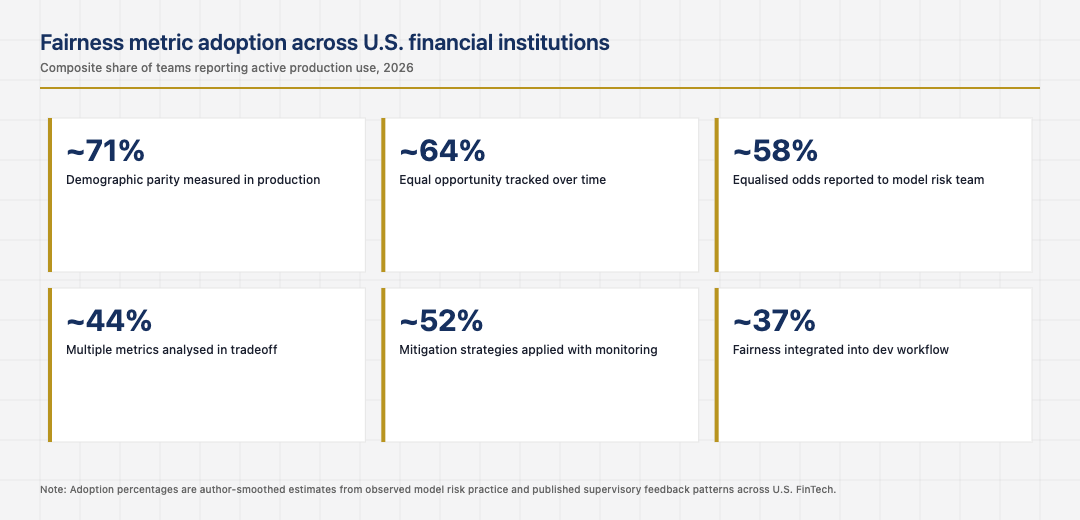
The fairness metrics literature is dense. The metrics that have proven most useful in U.S. financial machine learning practice are a smaller set: demographic parity, equal opportunity, equalised odds, predictive parity, and calibration across groups. Each metric measures something different. Each is appropriate in different contexts. Each can be in tension with the others, which is the most important fact for institutions to internalise.
The institutions that picked metrics deliberately based on the regulatory and ethical considerations applicable to each model tend to have defensible fairness analyses. The institutions that adopted a single metric universally usually find that the metric does not match all of their use cases, and the mismatch shows up in either supervisory feedback or in real-world outcomes that the metric did not capture.
The fundamental impossibility result
The most important fact in fairness metrics is that no model can satisfy all reasonable fairness criteria simultaneously when the underlying base rates differ across protected groups. This is not a technical limitation that better techniques will overcome. It is a mathematical impossibility result that the institutions deploying fairness analysis must understand.
The mature pattern is making the choice between fairness criteria explicitly, documenting the choice, justifying it in the regulatory and ethical context of the model’s use, and committing to monitor the chosen criteria in production. The pattern that fails is treating fairness as a single number that the model either passes or fails. The supervisors are sophisticated enough to ask which fairness criteria the institution prioritised and why. The institutions that have prepared substantive answers are well-positioned. The institutions that have not are not.
Mitigation strategies and the residual unfairness
Several mitigation strategies have proven useful in U.S. financial machine learning practice. Pre-processing approaches like reweighting training data, in-processing approaches like adversarial debiasing, and post-processing approaches like decision-threshold adjustment all have appropriate use cases. The mature pattern is selecting the mitigation strategy based on the model architecture, the regulatory context, and the operational constraints of the deployment.
The discipline that makes mitigation work is honest reporting of residual unfairness. No mitigation strategy fully eliminates the underlying tradeoffs. The institutions that document the residual unfairness, justify it in context, and continue to monitor it have defensible programs. The institutions that present mitigation as having solved the problem usually find their claims questioned by supervisors who understand the impossibility result better than the documentation suggests.
Operational integration and the development workflow
Fairness analysis works best when it is integrated into the model development workflow rather than bolted on at the end. The institutions that built fairness analysis into their model development tooling, with fairness metrics computed automatically alongside performance metrics, deliver fairer models without slowing development substantially. The institutions that treated fairness as a final-stage check usually find themselves either delaying deployment to address fairness issues that should have been caught earlier or deploying models with known fairness problems that the development workflow did not surface in time.
The cost of integrating fairness into the workflow is the cost of building the tooling and training the developers. The benefit is fairer models with less friction. The institutions that paid the upfront cost are now extracting it across every model they develop. The institutions that did not are paying a higher recurring cost on every model.
The next phase of fairness in U.S. financial machine learning
The next phase is shaped by the maturation of fairness tooling, the integration of fairness analysis with the broader explainability stack, and the continuing tightening of supervisory expectations around model fairness in consumer-affecting contexts. The institutions that built strong fairness foundations in the previous phase will absorb these changes cleanly. The institutions that have not will continue to face the choice between deploying models with unaddressed fairness concerns and not deploying models at all.
Read across the full picture, fairness metrics in U.S. financial machine learning in 2026 are a settled supervisory expectation with specific implementation patterns: deliberate metric selection, explicit acknowledgment of the impossibility result, honest reporting of residual unfairness after mitigation, and integration into the development workflow. The institutions that respect them deliver models that supervisors and customers both find defensible. The institutions that miss any one usually have either compliance theatre that supervisors see through or operational problems that fairness analysis would have caught.
Looking back across the full sweep makes one final point clear. The American financial system has accumulated its strength through the patient layering of standards, institutions, and supervisory expectations on top of an active commercial layer. The application layer captures attention because it is visible and fast-moving. The institutional layer captures durability because it is invisible and slow-moving. Operators who learn to read both layers at once tend to outlast operators who only read the visible one, and the discipline of doing so is not glamorous but it is the discipline that consistently shows up in the firms that compound through multiple cycles instead of just the one they happened to start in.
The same lesson shows up in the founders who quietly build through down cycles that catch the louder ones flat-footed. Reading the institutional rebuild as carefully as the product roadmap is what separates the long-lived operators in 2026 from the ones whose names appear only in retrospectives. The competitive position of the next decade will turn less on the surface features that draw press attention and more on the structural features that draw supervisory attention. The two are increasingly the same set of features, and the operators who recognise that early are the ones who position correctly while the rest are still arguing about whether the rules apply to them.
One last consideration is worth carrying forward. Cross-cycle perspective sharpens any single decision. Looking at how peer ecosystems have handled the same question, what they got right and where they stumbled, almost always reveals something about the decisions that the U.S. system is in the middle of making right now. The operators who travel intellectually as well as commercially tend to make better forecasts about which infrastructure layer will matter most in the next phase, and which segment is being quietly reset under the noise of the daily news. The disciplined version of that practice is what the next ten years of American FinTech will reward most consistently.