Predictive modelling for finance has changed character meaningfully over the past five years. The methods used to be statistical: logistic regression, gradient boosting, simple ensemble models with carefully crafted features. The methods now span a wider range, from traditional statistical models through deep learning to large language models applied to financial text. The challenges have changed less than the methods. Data quality, model risk management, explainability, and the integration of model outputs into operational workflows are still where most of the difficulty sits.
This piece looks at where predictive modelling for U.S. finance is actually delivering value in 2026, the methodological choices that distinguish strong programs, the supervisory environment that constrains deployment, and the operational disciplines that determine whether predictions translate into business outcomes.
The categories where prediction is genuinely productive
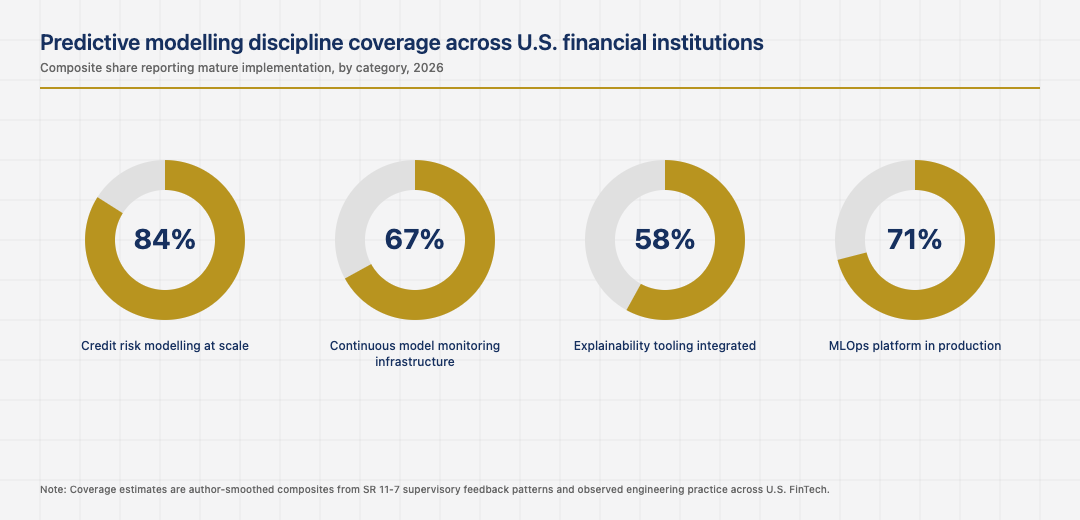
Several prediction categories in U.S. finance produce consistent value: credit risk modelling, fraud detection, churn prediction, transaction categorisation, marketing-response modelling, and operational forecasting for staffing and capacity. Each category has dense data, clear ground truth that emerges within a tractable time window, and measurable outcomes that allow models to be evaluated against business metrics rather than only against statistical metrics.
The categories that produce less consistent value are the ones with sparse data, ambiguous ground truth, or long feedback loops: macro-economic forecasting, long-horizon market-return prediction, and customer lifetime value at granular individual scale. The institutions that pursue these categories anyway sometimes capture insight, but the reliability of the output is structurally lower than in the productive categories. The discipline of matching the modelling effort to the category is unglamorous and consequential.
Feature engineering versus end-to-end learning
The methodological debate between careful feature engineering and end-to-end deep learning has settled into a pragmatic mix in U.S. finance. Tabular data with rich semantics, which is most of finance, continues to benefit from feature engineering with statistical models or gradient boosting. Image-like data, sequential data, and text are the categories where end-to-end deep learning genuinely outperforms.
The institutions that match methods to data types deliver better predictions than the institutions that try to apply one technique universally. The institutions that resisted deep learning in categories where it would have helped underperform. The institutions that adopted deep learning in categories where gradient boosting would have been better also underperform. The pragmatic mix is the right answer, and the institutions that found it early are now ahead.
Model validation as a continuous practice
Model validation in U.S. finance is increasingly treated as a continuous practice rather than a point-in-time event. Models are validated at deployment, monitored continuously for performance drift, re-validated when monitoring surfaces problems, and retired when the validation can no longer support continued use. The institutions that built continuous validation infrastructure satisfy SR 11-7 expectations cleanly while extracting more value from their model investments.
The institutions that treated validation as a deployment gate, performed once and then assumed indefinitely, usually have models that have drifted from their intended performance. The drift may not be visible in routine operation but becomes visible when supervisors ask to see recent validation evidence. The cost of building continuous validation is modest. The cost of being unable to demonstrate it is higher than most institutions initially appreciate.
Explainability and the operational integration
Explainability matters for two reasons in U.S. financial predictive modelling. The first is regulatory: supervisors expect models that affect customers to be explainable. The second is operational: predictions that the operating teams cannot understand are usually predictions the operating teams will not act on. The institutions that built explainability tooling for both reasons capture both benefits. The institutions that treated explainability as only a regulatory concern usually find that their predictions are technically correct and operationally underused.
SHAP attribution, surrogate models, structured rationale generation, and traceable decision logs are all standard techniques for producing explainable outputs from otherwise complex models. The institutions that adopted them universally are well-positioned. The institutions that adopted them selectively usually have a model portfolio with mixed explainability, which complicates supervisory engagement and operational integration alike.
The next phase of predictive modelling in U.S. finance
The next phase is shaped by the integration of large language models into financial decisioning, the maturation of foundation models fine-tuned on financial data, and the continuing pressure on institutions to extract more operational value from their model investments. The institutions that built strong foundations in the previous phase, with mature MLOps, continuous validation, and integrated explainability, will absorb these changes cleanly.
Read across the full picture, predictive modelling for U.S. finance in 2026 is a settled discipline with specific patterns that distinguish productive programs from sprawling ones. Matching modelling effort to category, mixing methods pragmatically, treating validation as continuous practice, and integrating explainability for both regulatory and operational reasons are the patterns that compound. The institutions that respect them deliver predictions that drive business outcomes. The institutions that miss any one usually deliver model demos rather than operational value.
Looking back across the full sweep makes one final point clear. The American financial system has accumulated its strength through the patient layering of standards, institutions, and supervisory expectations on top of an active commercial layer. The application layer captures attention because it is visible and fast-moving. The institutional layer captures durability because it is invisible and slow-moving. Operators who learn to read both layers at once tend to outlast operators who only read the visible one, and the discipline of doing so is not glamorous but it is the discipline that consistently shows up in the firms that compound through multiple cycles instead of just the one they happened to start in.
The same lesson shows up in the founders who quietly build through down cycles that catch the louder ones flat-footed. Reading the institutional rebuild as carefully as the product roadmap is what separates the long-lived operators in 2026 from the ones whose names appear only in retrospectives. The competitive position of the next decade will turn less on the surface features that draw press attention and more on the structural features that draw supervisory attention. The two are increasingly the same set of features, and the operators who recognise that early are the ones who position correctly while the rest are still arguing about whether the rules apply to them.
One last consideration is worth carrying forward. Cross-cycle perspective sharpens any single decision. Looking at how peer ecosystems have handled the same question, what they got right and where they stumbled, almost always reveals something about the decisions that the U.S. system is in the middle of making right now. The operators who travel intellectually as well as commercially tend to make better forecasts about which infrastructure layer will matter most in the next phase, and which segment is being quietly reset under the noise of the daily news. The disciplined version of that practice is what the next ten years of American FinTech will reward most consistently.
Last updated: June 17, 2026