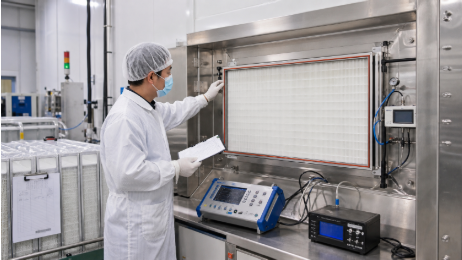
Figure 1. HEPA filter manufacturing and testing in a controlled production environment. Image courtesy of LENGE.
By the LENGE Technical Team
A HEPA filter can pass its release test and still perform differently from the units produced before it. The certificate records the result; it does not explain whether the variation came from the media lot, pleat geometry, sealing process, test airflow, or field conditions.
For air filter manufacturers, that missing context is the real performance problem. Efficiency, local leakage, resistance, sealing, dust loading, and service life interact. Optimizing one variable can weaken another, so reliable improvement requires traceable data across materials, production, testing, and use.
The goal is not more data. It is a data trail that supports a specific design, production, release, purchasing, or maintenance decision.
Why a Pass/Fail Certificate Is Not Enough
Classification and release testing remain essential. ISO 29463-1:2024 defines a framework for the classification, performance, testing, and marking of high-efficiency filters. But classification answers only part of the manufacturing problem. It establishes what must be demonstrated; it does not explain the source of variation between otherwise comparable units.
An engineering dataset should preserve both the final decision and the conditions behind it. At minimum, a result needs the filter model, serial or lot identifier, rated airflow, actual test airflow, aerosol and particle-size basis, temperature, humidity, instrument status, overall efficiency, local scan result where applicable, and initial resistance.
Without this context, teams may compare results that are not truly comparable. A pressure-drop value at one airflow cannot be treated as equivalent to a value measured at another airflow. Media-level efficiency cannot prove that the finished assembly is free from frame, gasket, gel-seal, adhesive, or installation bypass. A “pass” also cannot show whether a process is stable or gradually drifting toward failure.
Begin With a Decision, Not a Dashboard
Before building a dashboard or predictive model, define the operational decision the analysis must support. Useful questions include:
- Is resistance increasing within one product family even though units still meet specification?
- Are local leak failures concentrated by media lot, sealing batch, assembly station, shift, or geometry?
- Which design variables explain the efficiency-versus-resistance trade-off at the intended airflow?
- Can field pressure-drop trends distinguish normal loading from an abnormal process release or inadequate prefiltration?
- Which measurements are reliable enough to support process control, and which require a measurement-system review first?
Each question implies a different dataset and analytical method. Combining them into one “quality score” usually hides more than it reveals.
Build a Traceable HEPA Manufacturing Dataset
The most valuable data model follows the physical filter from incoming material to field removal. Every record should connect through stable identifiers rather than product descriptions typed differently by separate departments.
Figure 2. Media-lot traceability and pleat-geometry inspection during HEPA filter production. Image courtesy of LENGE.
1. Material and design data
- Media supplier and lot, thickness, basis weight, roll position where available, and supplier test data.
- Filter dimensions, pleat depth, pleat count, spacing, pack depth, and calculated effective media area.
- Frame material, separator or mini-pleat configuration, face guard, gasket or gel-seal design, and adhesive specification.
- Intended filter class, rated airflow, temperature limit, humidity limit, and installation orientation.
These fields allow engineers to separate a product-design change from a production-process change. They also prevent a model from treating physically different filters as if they belonged to one stable population.
2. Process data
- Pleating machine, setup recipe, line speed, actual pleat-spacing checks, and recorded interventions.
- Adhesive or sealant lot, dispensed quantity or process setting, cure time, cure temperature, and hold time before testing.
- Assembly station, tooling or fixture identifier, operator or automated-equipment identifier, and rework history.
- Environmental conditions that could materially affect curing, media handling, or testing.
Process records should capture actual conditions, not only the approved recipe. If the database stores the target cure temperature but not the observed temperature, it cannot explain a deviation that occurred during execution.
3. Test and release data
- Instrument identifier and calibration status.
- Test aerosol, particle-size basis, sampling configuration, and test method.
- Actual airflow, initial resistance, overall penetration or efficiency, local scan observations, repair and retest history, and final disposition.
- Timestamp, test station, software or method revision, and reviewer approval.
Retests should remain visible. Replacing a failed result with the final passing result destroys information about process capability and rework cost.
4. Field-performance data
- Installation location, air-handling unit, prefilter arrangement, commissioning airflow, and initial differential pressure.
- Operating hours, production mode, temperature, humidity, cleaning events, shutdowns, and abnormal particulate releases.
- Differential-pressure and airflow readings captured at a consistent operating state.
- Removal date, removal reason, inspection findings, integrity-test result where applicable, and disposal record.
Field data is often incomplete because the filter manufacturer does not operate the facility. A smaller, consistently defined dataset is more useful than a large collection of values recorded under unknown conditions.
Use Statistical Process Control Before Machine Learning
Machine learning cannot repair an unstable measurement system or inconsistent test conditions. The first analytical layer should normally be descriptive statistics and statistical process control. The NIST/SEMATECH Engineering Statistics Handbook describes control charts as tools for comparing current process behaviour with an established in-control baseline and identifying signals that warrant investigation.
Specification limits and control limits answer different questions. A specification limit asks whether the unit meets an acceptance requirement. A control limit asks whether the process is behaving like the stable process used to establish the baseline. A filter can remain within specification while a run chart or control chart reveals a sustained shift in resistance.
Match the chart to the data
- Continuous measurements such as resistance, adhesive weight, pleat depth, or media-pack dimensions may be monitored with an appropriate variables chart.
- Counts or proportions, such as the share of units requiring leak repair, need an attributes method that accounts for the number of opportunities inspected.
- When production volume is low or filters are highly customized, an individuals-and-moving-range approach may be more defensible than forcing artificial subgroups.
- Multiple correlated characteristics should not be combined casually. Efficiency, resistance, and scan-test penetration may require stratification or a validated multivariate method.
Control limits should be established from a stable period and reviewed through formal change control. Recalculating limits after every undesirable result can normalize deterioration instead of detecting it.
Separate Process Signal From Product Mix
A common analytical mistake is to put every HEPA model into one dataset and interpret the average. Different dimensions, media areas, airflow ratings, frames, and operating limits create expected differences that can resemble process drift.
Analysis should therefore begin within technically comparable groups. Useful stratification variables include product family, rated airflow, media grade, pleat geometry, seal design, and test method. When a portfolio contains many low-volume configurations, a hierarchical model or engineering normalization may be useful, but the transformation must reflect validated filter physics rather than statistical convenience.
This is also where data quality becomes visible. Duplicate serial numbers, missing units, inconsistent airflow fields, and overwritten retests are not minor database issues; they can reverse an engineering conclusion.
Add Multivariate Analytics Only When the Data Earns It
Once measurements are reliable and the process baseline is understood, multivariate methods can identify combinations of small changes that univariate charts may miss. An anomaly-detection model might flag an unusual combination of media lot, pleat spacing, cure profile, resistance, and scan pattern even when no single value crosses a limit.
The model should support investigation, not replace release testing or validated acceptance criteria. Three controls are especially important:
- Split validation data by time or production lot, not by randomly mixing records from the same lot across training and test sets.
- Keep product configuration and test conditions as explicit features so the model does not learn a false association from product mix.
- Monitor model drift after material, equipment, software, test-method, or product-design changes.
Interpretability matters. A maintenance or quality engineer needs to know which variables made a unit unusual and whether the signal points to material, geometry, sealing, testing, or an unknown condition.
Connect Factory Results With Field Pressure Drop
Factory data explains how the filter was made. Field data shows whether the design and selection worked within the complete air-handling system.
Pressure-drop trends should be interpreted with airflow and operating context. Rising resistance at a comparable airflow may indicate loading. A sudden change after a process release may reflect an abnormal particulate event. Falling airflow with stable filter resistance may instead point to a fan, damper, control, or system-balance problem.
The feedback loop becomes actionable when the removal reason and field condition return to the original manufacturing record. Engineers can then ask whether service life differs by media lot, geometry, prefiltration strategy, or application. They can also identify where the filter is being blamed for a system problem it did not cause.
A Practical Four-Phase Implementation
Phase 1: Establish measurement confidence
Confirm units, instrument calibration, method revisions, airflow conditions, identifier rules, and retest handling. Resolve missing or contradictory fields before building performance models.
Phase 2: Create traceability and baseline views
Connect incoming material, production, final testing, and disposition. Build distributions and control charts within comparable product families.
Phase 3: Link causes to outcomes
Use structured investigations, designed experiments where appropriate, and multivariate analysis to test whether suspected inputs genuinely explain resistance, leakage, or rework.
Phase 4: Close the field loop
Collect a limited set of consistent commissioning, operating, pressure-drop, maintenance, and removal data. Use it to refine selection guidance and design priorities.
What Buyers Should Request
Data-driven procurement does not require access to a manufacturer’s entire production database. Buyers should ask for evidence that is comparable and relevant to the proposed operating condition:
- Filter classification and test basis, not only a headline efficiency percentage.
- Rated airflow and initial resistance at that airflow, with a performance curve where appropriate.
- Overall and local leak-test documentation suitable for the filter class and application.
- Materials, seal configuration, operating limits, installation requirements, and change criteria.
- Lot traceability, individual test documentation where required, and a clear approach to nonconforming product and retest history.
For examples of commercially available HEPA and ULPA filter configurations, see LENGE’s air filter range. The selection should still begin with the required cleanliness, airflow, pressure-drop budget, operating environment, and installation method—not with the catalogue name.
Better Data Produces Better Engineering Decisions
The strongest HEPA analytics programs do not begin with artificial intelligence. They begin with comparable tests, stable identifiers, preserved retest history, controlled measurement systems, and a clear link between the decision and the data.
When material, design, process, release, and field records are connected, manufacturers can identify drift earlier, investigate failures faster, and understand the trade-offs that matter to the complete air-handling system. The result is not simply a better dashboard. It is a more defensible way to design, manufacture, select, and maintain high-efficiency filters.
Frequently Asked Questions
What data matters most when evaluating HEPA filter performance?
Start with the filter model and lot, rated and actual test airflow, initial resistance, efficiency or penetration result, local leak-scan result where applicable, test method, instrument status, and retest history. These fields make results comparable and traceable.
Why should HEPA pressure drop be compared at the same airflow?
Pressure drop changes with airflow. Comparing readings taken at different flow rates can make normal operating differences look like filter deterioration or manufacturing variation.
Can analytics replace HEPA filter integrity testing?
No. Analytics can reveal trends, drift, and unusual combinations of variables, but release and integrity decisions must still follow the applicable validated test method and acceptance criteria.
What should buyers request from an air filter manufacturer?
Request the classification and test basis, rated airflow, initial resistance, relevant leak-test documentation, material and seal details, operating limits, traceability, and clear handling of nonconforming units and retests.
How can field data improve future HEPA filter selection?
When commissioning airflow, differential-pressure trends, operating context, maintenance events, and removal reasons are linked to the original production record, teams can distinguish loading, abnormal releases, system faults, and application mismatch.
Author bio: LENGE manufactures pharmaceutical cleanroom equipment and filtration products for controlled environments. Its portfolio includes HEPA and ULPA filters, laminar airflow systems, pass boxes, air showers, dispensing booths, and related contamination-control equipment.