
Why Position Sizing Drives Algorithmic Performance

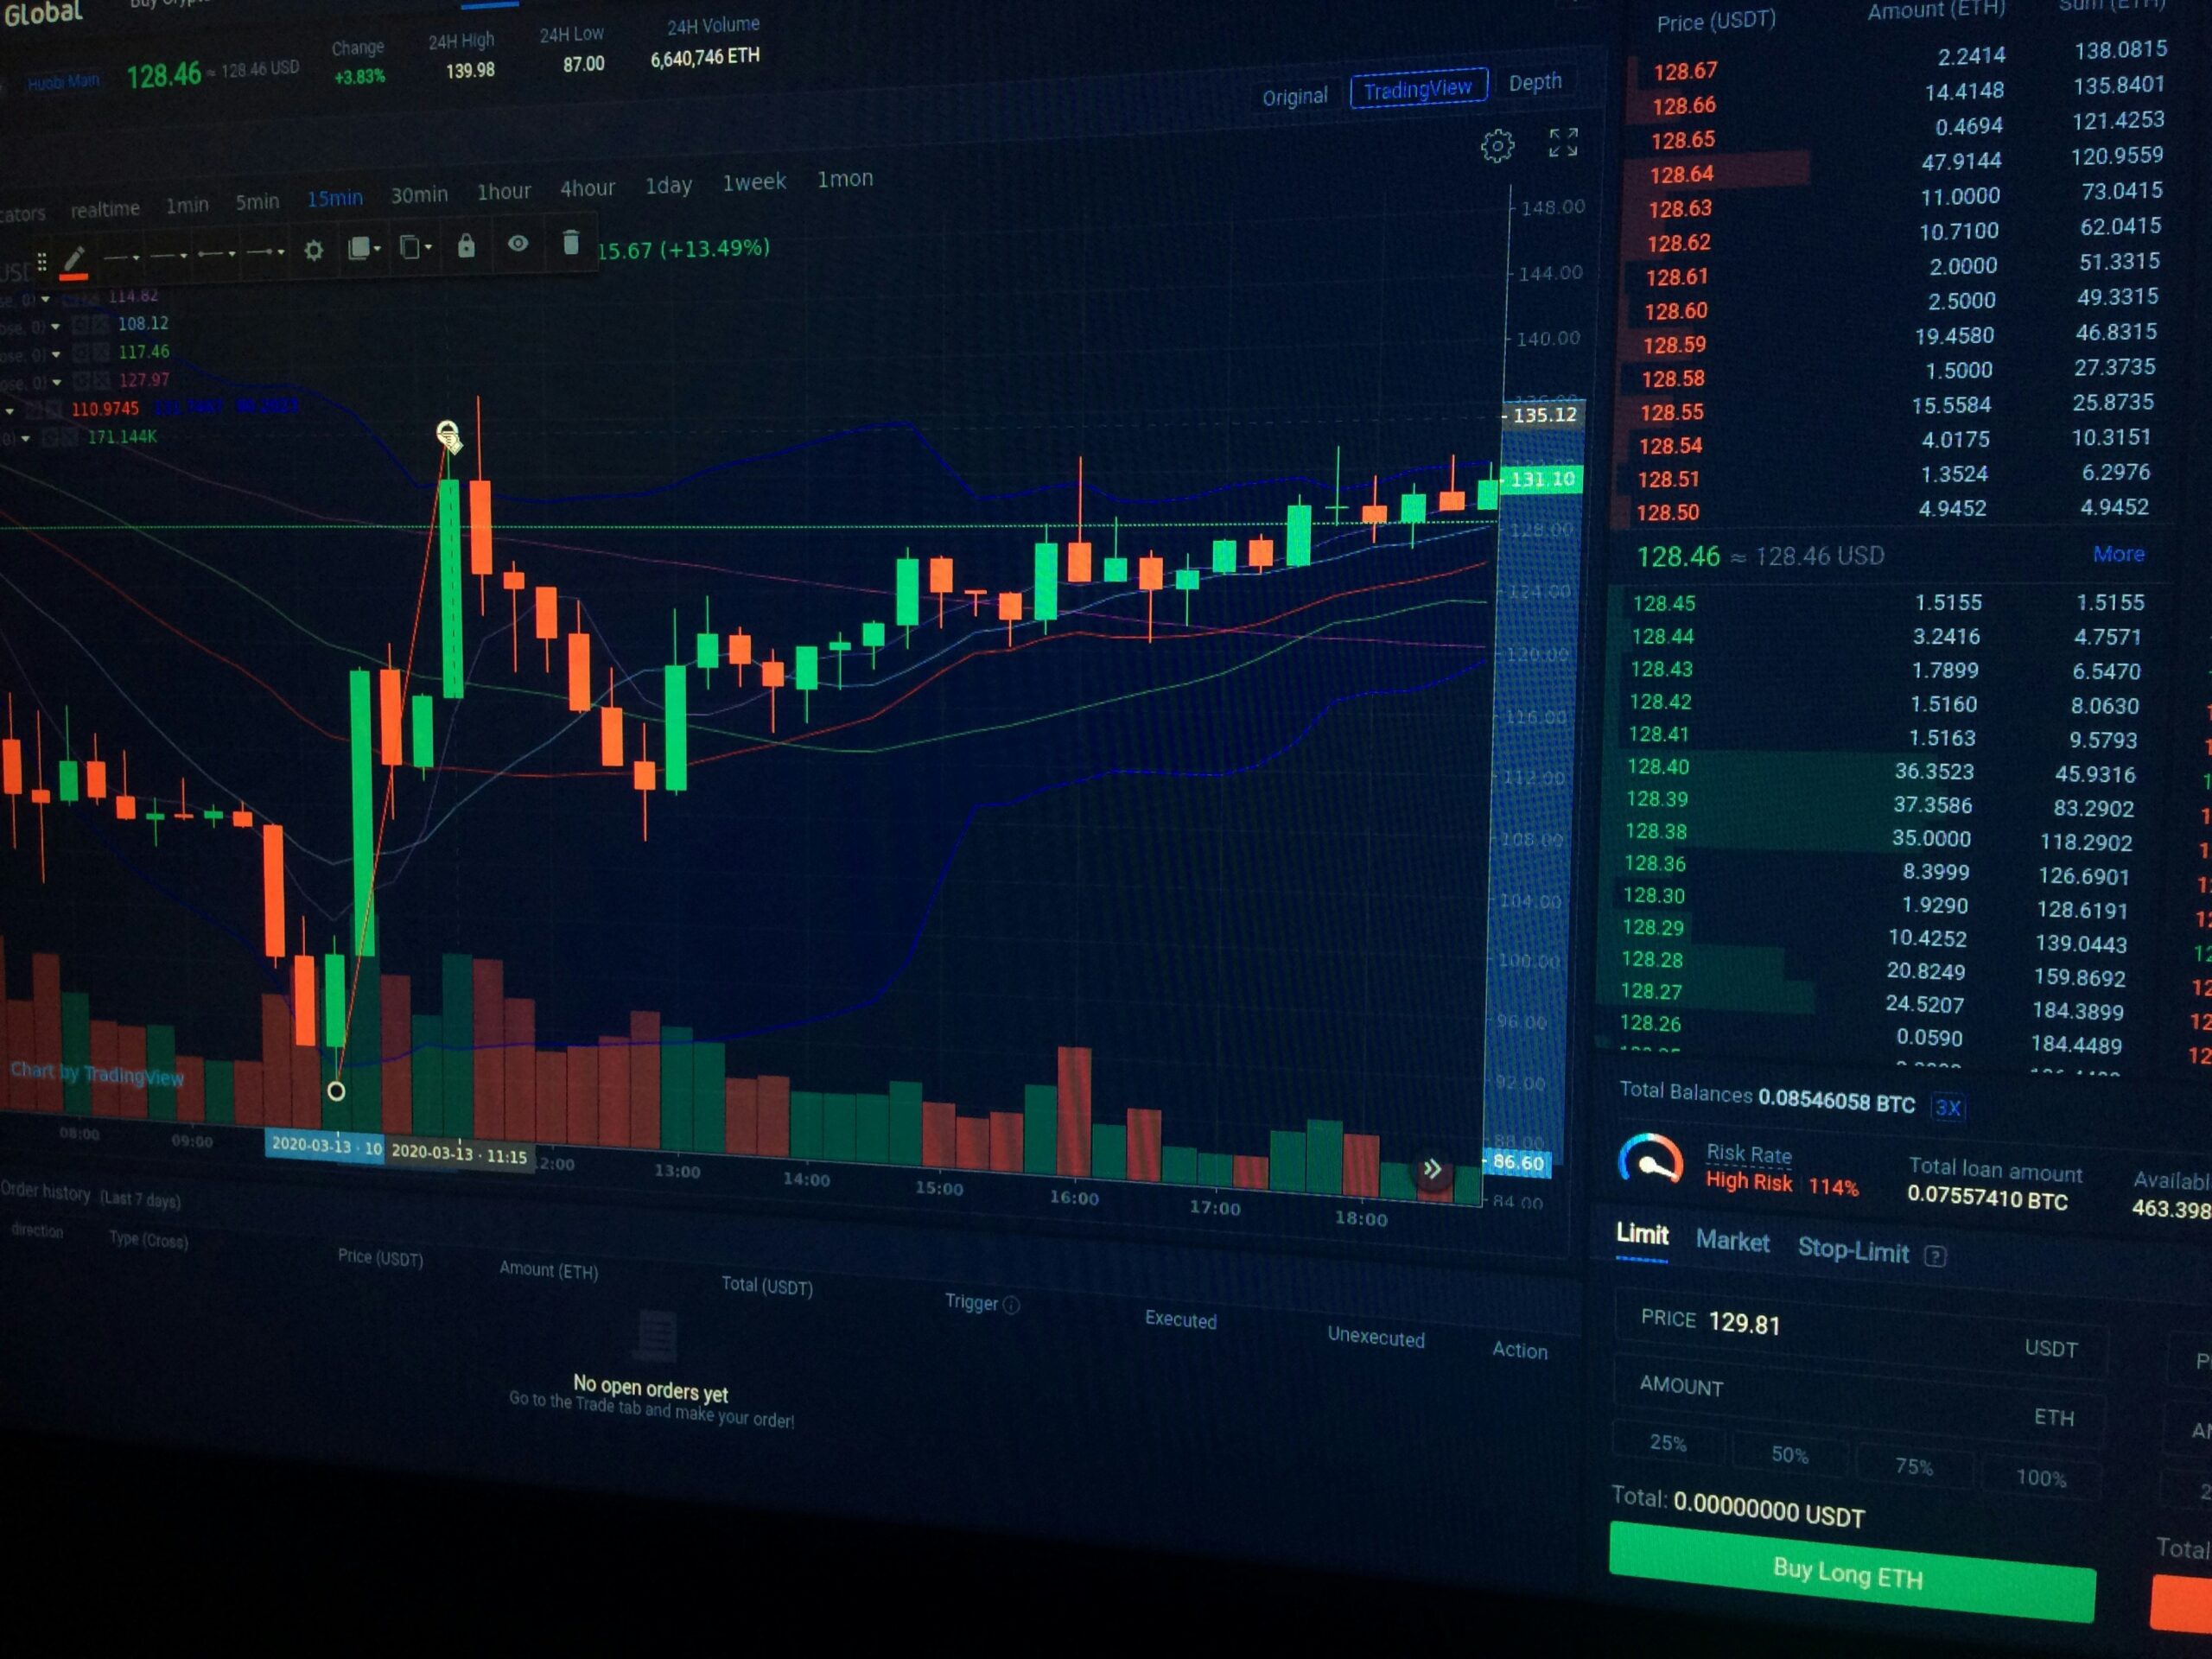
Grand View Research reports that the algorithmic trading market was valued at $21.06 billion in 2024 and will reach $42.99 billion by 2030. Seeing as the market will double in size within a few years, it’s no surprise that there’s rising interest in it.
In algorithmic trading, people mostly focus on signals, such as entry points, indicators, and predictive models. However, even the best signal can significantly fail if there’s poor position sizing.
When it’s applied correctly, position sizing can transform inconsistent strategies into robust ones. It’s the true driver of algorithmic performance, and we’ll show you why in this article. We’ll also explain how different methods impact key metrics like the Sharpe ratio (measurement of an investment’s return adjusted for its risk) and max drawdown (peak-to-trough decline of an account’s equity or an asset’s price over a specific period), and what validation checks you should use to ensure your sizing logic holds up.
Position Sizing Is the Real Engine Behind Strategy Performance
The strength of most algorithmic strategies is determined by how capital is allocated, not by their signals. Position sizing determines:
- Volatility
- Compounding
- Drawdown behavior
These are all key drivers of the Sharpe ratio and long-term survivability.
Sizing acts as a control system, and it can smooth returns and limit downside exposure. This means that even a mediocre signal paired with disciplined sizing can outperform a strong signal that’s inconsistently scaled or over-leveraged. Without sizing, even statistically robust strategies can produce erratic equity curves.
Professional quant strategies devote significant effort to refining sizing logic because it governs how edge is translated into returns. This means that sizing isn’t just a risk tool; it’s also a performance engine.
Volatility Targeting Stabilizes Return Distributions
Volatility targeting adjusts exposure to maintain a consistent level of portfolio risk. When volatility rises, position sizes are reduced; when it falls, exposure increases.
This stabilizes return distributions, and it can improve the Sharpe ratio by lowering variance. It can also help reduce drawdowns and tail risk during turbulent periods since it automatically de-risks. For example, a 100% volatility target ensures that the strategy doesn’t become overexposed during crises.
Do note that implementation does matter; lagging volatility estimates can delay adjustments and increase risk. You should use adaptive measures like exponentially weighted volatility to improve responsiveness while avoiding excessive turnover.
ATR-Based Sizing Aligns Risk With Market Structure
Average True Range (ATR)-based sizing is a method that calculates the optimal size of each position, and it’s used as a market volatility indicator. It scales position sizes according to recent price movement.
Larger ATR values indicate higher volatility, and this prompts smaller positions. On the other hand, lower ATR values allow for larger allocations.
Each trade contributes a similar level of risk, and this improves consistency in returns for solid money management in trading. In addition, it reduces the likelihood of outsized losses during volatile conditions, and this can help manage tail risk.
ATR-based methods are especially useful across diverse instruments with varying volatility profiles. But do note that they can lag during rapid regime shifts. Plus, overly short lookback periods may introduce noise and increase trading frequency.
Fractional Kelly Optimizes Growth While Managing Risk
The Kelly criterion is used in probability theory, and it’s a formula that allows you to calculate risk allocation and maximize wealth by determining the optimal allocation of your capital. Essentially, it provides a theoretically optimal allocation based on expected return and variance.
What’s important to know with algorithmic trading is that full Kelly sizing is often too aggressive in practice. This can lead to high volatility and deep drawdowns.
Instead, fractional Kelly (such as half or quarter Kelly) offers a more balanced approach. Traders can retain much of the growth potential while significantly reducing risk.
As a result, this improves long-term compounding and stabilizes performance metrics like the Sharpe ratio. In addition, it helps mitigate tail risk by limiting exposure to estimation errors.
Kelly-based methods still rely heavily on accurate inputs, though. This makes them sensitive to model misspecification and overfitting.
Drawdown-Aware Sizing Protects Capital During Stress
Drawdown-aware sizing can reduce position sizes as losses accumulate. This creates a feedback mechanism that limits further downside.
This approach is particularly useful for traders during losing streaks or adverse market regimes. If you scale down exposure after losses, then it reduces the probability of catastrophic drawdowns and improves capital preservation, too.
It’s true that drawdown-aware sizing can slow recovery during favorable periods. However, the tradeoff is improved survivability, which is much more important.
Many institutional strategies incorporate drawdown thresholds or risk budgets to enforce these controls. This method is especially valuable in non-stationary markets where conditions can change quickly.
Position Sizing Directly Influences the Sharpe Ratio
The Sharpe ratio is very sensitive to volatility, which is largely controlled by position sizing. Even if returns remain unchanged, reducing volatility can significantly improve the Sharpe ratio.
To smooth returns and reduce variance, consider using techniques like volatility targeting and ATR-based scaling. Be careful, though, as excessive smoothing can also dampen returns; balance is essential.
When done effectively, sizing can minimize unnecessary volatility while preserving the strategy’s core edge. In many cases, improvements in the Sharpe ratio come more from better risk control than from enhanced predictive signals.
Maximum Drawdown Is Primarily a Sizing Problem
Signals determine when losses occur, but position sizing determines their magnitude. Over-leveraging amplifies drawdowns, while disciplined sizing limits them.
Techniques like fractional Kelly and drawdown-aware scaling help cap downside risk. They also maintain drawdowns within acceptable levels, which is critical for investor confidence and long-term capital retention.
Even small improvements in drawdown control can significantly enhance a strategy’s attractiveness. But on the other hand, poor sizing can turn minor predictive errors into significant financial losses.
Tail Risk Emerges From Poor Sizing Decisions
Tail risk refers to rare but severe losses, and they can heavily impact your portfolio. The name comes from the fact that the rare events fall in the “tails” of a probability distribution curve (usually exceeding three standard deviations from the mean). It shows that unexpected crises happen more often than predicted.
In any case, these events are driven by excessive position sizes during volatile periods. Volatility targeting and ATR-based sizing help mitigate tail risk, though, as they reduce exposure when uncertainty increases. Fractional Kelly also helps by avoiding overbetting.
Of course, tail risk can’t be completely eliminated. However, proper sizing ensures that extreme events don’t cause irrecoverable damage. This makes it a critical component of robust strategy design.
Regime Drift Undermines Static Sizing Rules
Naturally, markets evolve every time, which means that static sizing rules may become ineffective as the conditions change. Regime shift can distort what used to be optimal sizing parameters. These shifts include ones in:
- Volatility
- Correlations
- Liquidity
For instance, a volatility target may be calibrated during calm markets. However, this may lead to excessive risk in turbulent periods if a trader still uses it.
Luckily, adaptive sizing methods (such as rolling volatility estimates) help address this issue. In addition, continuous monitoring and recalibration are essential to maintain performance and avoid unintended risk exposure.
Overfitting Position Sizing Is a Hidden Risk
Just like trading signals, position sizing models can be overfit. Optimizing parameters (such as ATR windows or Kelly fractions) on historical data may produce strong backtest results, but they may fail in live trading. Overfitted sizing models often lack robustness, and it’s common for them to perform poorly under new conditions.
Simpler, more generalized approaches tend to be more reliable. If you stress test across multiple market regimes, this can help identify overfitting and improve confidence in the model.
Combining Sizing Methods Can Improve Robustness
It may seem obvious, but no single sizing method is universally optimal. The best way to get multiple layers of control is to combine approaches, such as volatility targeting with drawdown-aware scaling. Or ATR-based sizing can manage trade-level risk, while portfolio-level controls stabilize overall performance.
Using hybrid approaches can improve the Sharpe ratio and reduce tail risk. This is because they address different dimensions of uncertainty.
However, the added complexity should be justified. It should also be carefully tested to avoid overfitting.
Transaction Costs Interact With Position Sizing
Frequent position adjustments can increase transaction costs. This is especially true in volatility-targeted or ATR-based systems. As a result, these costs can erode returns, and they can reduce the Sharpe ratio if they’re not properly managed.
Good strategies must balance responsiveness with efficiency. Ensure that adjustments are meaningful. To help reduce unnecessary trades, consider techniques like threshold-based rebalancing.
Don’t ignore transaction costs in backtests, as this often leads to overly optimistic results.
Liquidity Constraints Limit Practical Sizing
There are real-world constraints that can limit position sizing, such as liquidity and market impact. Large trades may move the market, and this reduces the execution quality and distorts performance. This is particularly relevant for institutional strategies or less liquid assets.
If you want to help ensure realistic and scalable performance, then it can be beneficial to incorporate liquidity-aware constraints into sizing models. It can also reduce the risk of slippage and adverse price movements during execution.
Simple Validation Checks Improve Confidence
Product validation is critical for ensuring that position sizing models are robust, so don’t skip this important step. You can use several techniques across different regimes to reveal weaknesses, such as:
- Out-of-sample testing
- Walk-forward analysis
- Stress testing
In addition, if you monitor metrics like rolling Sharpe ratio and drawdown consistency, you’ll get additional insight. Comparing multiple sizing approaches can highlight strengths and weaknesses, too.
Ultimately, these checks can help distinguish genuine improvements from artifacts of overfitting.
Position Sizing Determines Long-Term Compounding
Position sizing directly affects how returns compound over time. If there’s consistent and controlled growth, then this leads to exponential gains. But if there are large drawdowns, this hinders recovery.
Techniques like fractional Kelly and volatility targeting aim to maximize geometric returns while minimizing risk. “Geometric returns” refer to the average compounded growth rate of an investment over time.
By focusing on compounding rather than short-term gains, strategies can achieve more stable and sustainable performance. This long-term perspective is essential not only for individual traders, but also for institutional investors.
Frequently Asked Questions (FAQs)
How Does Leverage Interact With Position Sizing Strategies?
Leverage amplifies both returns and risks. This makes it closely tied to position sizing.
In many frameworks, effective leverage is an output of the sizing model; it’s not a separate decision. For example, volatility targeting may increase leverage in calm markets and reduce it during turbulent periods.
Misaligned leverage can distort performance metrics like the Sharpe ratio and increase drawdowns. This makes proper integration essential, as it ensures that leverage adapts dynamically to changing conditions. This maintains a good balance between risk and return.
Can Position Sizing Compensate for a Weak Trading Signal?
Yes, position sizing can enhance a weak but consistent signal by reducing losses and stabilizing returns. However, it can’t fully compensate for a lack of edge.
Sizing determines how risk is distributed, not whether a strategy is profitable. The best results come from combining a solid signal with robust sizing.
Without an underlying edge, even the best sizing approach will struggle to produce sustainable returns.
How Often Should Position Sizes Be Updated?
How often you update position sizes depends on your strategy and the market conditions. High-frequency strategies may adjust continuously, while longer-term strategies rebalance less often.
You should know that frequent updates improve responsiveness, but they increase transaction costs. Infrequent updates can reduce these costs, but you may miss changing risk conditions.
As with many things, a balanced approach can ensure adjustments are both timely and efficient. This can be done by using thresholds or periodic rebalancing.
What Role Does Diversification Play Alongside Position Sizing?
Diversification spreads risk across assets, while position sizing determines how much capital is allocated to each. Combined, they create a balanced portfolio.
Do note that even a diversified portfolio can suffer if individual positions are too large. Proper sizing ensures that risk contributions are evenly distributed, and this enhances stability and reduces drawdowns.
As you can see, the combination of both approaches leads to more consistent performance.
How Do Institutional Investors Approach Position Sizing Differently?
Institutional investors use multi-layered frameworks. These incorporate:
- Portfolio-level constraints
- Liquidity considerations
- Risk budgets
Also, they often combine multiple sizing techniques, as this allows them to manage different types of risks. Unlike smaller traders, institutional investors must also consider market impact and regulatory requirements. This means that their approach prioritizes:
- Stability
- Scalability
- Captial preservation
All of the above ensure consistent performance across varying market conditions.
How Do Correlation and Portfolio Interactions Affect Position Sizing?
As you may already know, position sizing doesn’t operate in isolation; correlations between assets can significantly amplify or reduce overall portfolio risk. Even if individual positions are sized conservatively, highly correlated trades can concentrate exposure and increase drawdowns during market stress.
Effective sizing frameworks account for this by adjusting allocations based on correlation structures. Often, they use risk parity or covariance-based approaches. That way, no single factor or market regime dominates portfolio performance.
If you ignore correlations, this can lead to underestimating tail risk and overstating diversification benefits. Quants and portfolio managers can build more resilient strategies that maintain stable performance across different environments by incorporating cross-asset relationships into sizing decisions.
Position Sizing Endures Across Market Cycles
Position sizing links strategy design, risk management, and long-term performance. Robust sizing frameworks can help maintain stability and consistency, even if signals degrade as markets evolve.
For more information about trading, keep browsing our website now.
Author bio: Stephanie Heron is a financial market researcher with over 15 years of writing experience.
Sources/references:
- https://www.axi.com/int/blog/education/money-management-trading-strategies
- https://www.grandviewresearch.com/industry-analysis/algorithmic-trading-market-report
- https://techbullion.com/how-modern-traders-decode-volatility-with-the-qqe-indicator/
- https://www.investopedia.com/terms/m/maximum-drawdown-mdd.asp
- https://www.backtestbase.com/education/how-to-analyze-tradingview-backtest-results
- https://techbullion.com/product-validation-what-it-actually-means-and-why-most-teams-skip-the-hard-part/
- https://initialreturn.com/geometric-average-return-calculator-formula







Comment