Two phones, a quick screen tap, and a few dollars move between strangers at a restaurant table. That gesture is now a daily reflex for tens of millions of US adults, and the rails underneath have grown into one of the largest consumer-facing payment systems in the country. The companies running those rails are now spending most of their product budget on fraud control and on the small monetisation seams that turn a free service into a margin business, while the regulators that oversee them are spending most of their bandwidth on the same questions.
US peer-to-peer payment volume is on track to exceed $1.6 trillion in annual transfers across the major networks by 2028, per Juniper Research, with Zelle, Cash App and Venmo absorbing the majority of that flow. The user-experience layer has largely stabilised. The competition has shifted into safety, instant-transfer pricing and the small adjacent services that ride on top of a P2P account, and the answers each network gives to those questions will define their share position over the next three years.
Zelle Crossed a Trillion Dollars and Kept Going
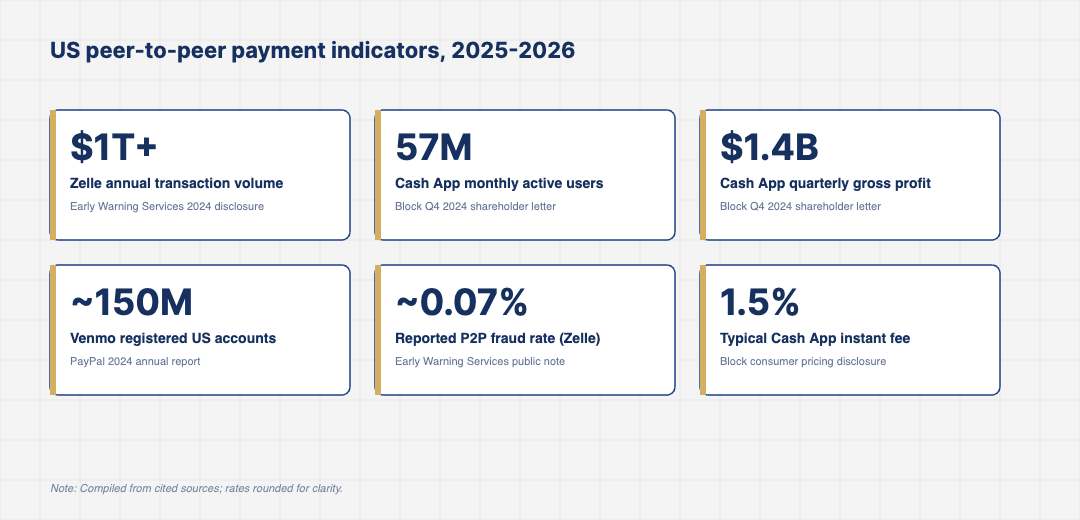
Early Warning Services, the bank consortium behind Zelle, disclosed that the network processed more than $1 trillion in payments during 2024, the first US P2P network to clear that threshold in a single year. Transaction count sits in the low billions per year, with average ticket size considerably higher than at Cash App or Venmo because Zelle skews toward rent, contractor payments and family transfers rather than restaurant splits.
The product trade-off Zelle made early was speed and bank-account directness over a consumer brand. That trade-off keeps paying off on volume but exposes the network to higher-value scam attempts. The network has been pressured by lawmakers and the Consumer Financial Protection Bureau through 2024 and 2025 over the share of authorised push-payment fraud that customers absorb directly. The participating banks have responded with new in-app warnings, intermittent transaction holds and refund programs for impersonation scams, all of which add latency or friction that the original product was built to avoid.
The longer-term question is whether Zelle remains a feature inside bank apps or becomes a more visible standalone surface. Several large issuers have begun co-marketing it as a near-peer to Cash App and Venmo, but the bank-app distribution remains the moat, and that distribution is what keeps the average transfer size in three- and four-figure ranges rather than the single- and double-digit averages at the consumer brands.
Cash App Is Now a Banking Surface, Not Just a Wallet
Block’s Cash App reported 57 million monthly active users and roughly $1.4 billion in quarterly gross profit at the end of 2024, per its Q4 2024 shareholder letter. The P2P transfer use case is still the entry point for most new users, but the revenue mix has moved decisively toward Cash App Card interchange, Bitcoin trading, instant-deposit fees and a small but growing share from Borrow and savings products.
That product mix matters for how the rails evolve. The economics of free P2P only work if there is a paying product on the other side, and Cash App has demonstrated that the wallet can become a primary banking surface for younger US consumers, particularly those underserved by traditional bank product design. Block’s 2025 disclosures show direct-deposit users continuing to grow as a share of the active base, and direct-deposit users monetise at multiples of the average user. The next product question for Cash App is how far up the income curve those direct-deposit users can be pushed, and whether the brand can move past its early reputation as a wallet for younger and lower-income consumers without losing what made it work.
Venmo’s Path Runs Through Commerce
PayPal’s Venmo reported roughly 150 million US registered accounts in its 2024 annual report, with total payment volume in the tens of billions per quarter. Venmo’s social feed remains a distinctive product surface, but the team has spent the past two years pushing Venmo as a checkout option at major US retailers rather than purely as a P2P utility, and that pivot is starting to register in the disclosure cadence.
The shift is a deliberate response to the limits of free transfer revenue. PayPal earns essentially nothing on a friend-to-friend bank-funded transfer, so the route to margin runs through Venmo-funded purchases at brands like DoorDash, Starbucks and a long tail of e-commerce merchants. Acceptance growth has been the single biggest 2024-2025 product investment, with the company reporting double-digit growth in monthly active checkout users on the platform. Venmo Debit, the company’s debit card product, has also become a meaningful part of the consumer story, with growing interchange revenue tied to it.
One understated dynamic is the network effect that runs in reverse on the bank-funded side. Every additional retailer accepting Venmo or Cash App at checkout slightly reduces the volume that has to ride card rails, and slightly increases the closed-loop processing share that the wallet retains. PayPal and Block both call this out in investor commentary; it is a smaller number than the headline P2P volume but a much higher-margin one, and it is the most likely lever for both networks to expand operating margin without raising P2P fees.
Fraud Is Now the Defining Operational Problem
The big three P2P networks all report scam losses on a roughly similar scale relative to volume, in the range of $200 million to $500 million per network per year depending on definitions. The fraud mix has shifted from account takeover, where the customer is not at fault, to authorised push-payment scams where the customer initiates the transfer under false pretences. That distinction matters legally and operationally, because Reg E does not require institutions to refund authorised transactions, and the question of where the line sits has been the subject of multiple bills and regulatory consultations through 2025.
The defences have grown in turn. Networks now share intelligence on suspect recipient accounts, push warnings when transfer patterns match known scam typologies, and slow or hold transfers above certain thresholds for first-time recipients. None of these completely solve the problem. The fraud surface keeps shifting as scammers move from romance scams to fake government refunds to elaborate small-business impersonation. The networks that compound their fraud-model and customer-comms capability are the ones that hold consumer trust into 2027 and beyond.
Bank-led P2P operators are also rebuilding the customer-comms layer. Push notifications, in-app dispute flows and proactive contact when a transfer pattern looks anomalous have all become standard, and the share of complaints resolved without a CFPB filing has become a tracked KPI rather than a soft metric. The networks that win the next round of regulator scrutiny will be the ones that can show measurable reductions in both fraud incidence and customer escalation.
Where the 2026 P2P Spend Is Concentrating
Three buckets absorb most of the new P2P investment at major US providers. Instant-transfer infrastructure sits at the top, with all three majors now offering same-rail or card-rail instant payouts, charging between 1.5% and 1.75% per transfer. That fee line has become a meaningful portion of the revenue mix at Cash App and Venmo, and it has prompted Zelle to consider its own paid speed tiers.
The second bucket is fraud signal pooling and account-recipient risk scoring, which is moving from individual-bank scope into network-wide shared infrastructure. The third bucket is identity and onboarding, where the networks are tightening know-your-customer flows on new accounts and re-verifying long-dormant ones in response to regulator pressure. None of these investments produce a marketing moment. They show up in retained users, lower per-transaction loss rates and a slow tightening of the regulatory perimeter that the networks operate inside.
For operators and investors tracking US P2P payments through 2026, the practical signal is to watch instant-transfer take rates, fraud loss per million in volume and the share of revenue coming from non-P2P products at each network, because those three metrics together will explain the gap between the networks that compound and the ones that stall during a period of heavier regulator attention.