
Nvidia Stock Prediction 2026–2030: What Does $217 Assume?


Nvidia Stock Prediction 2026 to 2030 Growth Risks and Valuation
Nvidia closed at $217.09 on October 19, 2026, about 10.8% below its $243.37 annual high. Its market capitalization was approximately $5.24 trillion. The question for the outlook through 2030 is how much future growth that price already reflects.
Financial Beings’ model tests perpetual growth in residual operating income at a 10% required operating return. Its FY2026 annual baseline produces present values of $60.87–$223.92 per share across 2%–8% growth assumptions. These are conditional valuations, not 2030 trading-price targets.
Where Nvidia Stands Today
Nvidia’s latest reported quarter ended July 26, 2026. Data Center generated approximately 92.5% of revenue, leaving the business closely tied to AI infrastructure spending. The segment also serves other accelerated computing workloads.
| Metric | Latest figure |
| Quarterly revenue | $96.2 billion (+106% year over year) |
| Data Center revenue | $89.0 billion (+117% year over year) |
| GAAP gross margin | 75.0% |
| GAAP operating income | $63.7 billion |
| GAAP net income | $59.7 billion |
| Q3 FY2027 revenue guidance | $108 billion, plus or minus 2% |
| Capital returned in the quarter | About $26 billion (share repurchases and dividends) |
| Share price (Oct 19, 2026) | $217.09 |
| 52-week range | $164.27 – $243.37 |
What Could Support Growth Through 2030
AI infrastructure demand remains central. Nvidia’s $108 billion revenue guidance implies approximately 12% sequential growth, while assuming no Data Center compute revenue from China. Guidance expresses management’s expectations, rather than an achieved result.
Nvidia says Vera Rubin is in full production, with systems running at partners including CoreWeave, Google Cloud, Microsoft Azure, Oracle Cloud Infrastructure and Nebius. Its software, networking and system designs can raise switching costs, although continued deployment does not guarantee lasting pricing power or margins.
The quality of customer demand matters alongside its size. Customers need productive applications that justify continued infrastructure spending. Nvidia’s economic profits ultimately depend on customers obtaining enough value from computing capacity to keep committing capital.
Why the Supply Chain Matters
High-end data center systems require high bandwidth memory, advanced packaging and manufacturing capacity. Micron announced volume shipments of HBM4 designed for Vera Rubin. That establishes a product relationship, but does not establish exclusive supply or Nvidia’s total spending with Micron.
Nvidia reported $279 billion of supply and capacity commitments at July 26, up from $119 billion the previous quarter. These span multiple fiscal years. Some arrangements can be adjusted before firm orders, potentially at additional cost. They increase demand-forecasting exposure without representing immediately payable obligations or guaranteed revenue for one supplier.
Different earnings cycles also matter. The Micron vs Nvidia stock comparison examines why Micron’s lower operating earnings multiple depends on durable memory profits, while Nvidia’s valuation depends on sustained growth. A lower multiple alone does not establish better value.
Risks That Could Change the Outlook
China restrictions. Nvidia’s Q3 outlook assumes no Data Center compute revenue from China. This is different from reporting zero company-wide Chinese revenue.
Competing accelerators. Google TPUs and AWS Trainium demonstrate that large cloud customers already offer alternatives for some workloads. Wider adoption could constrain Nvidia’s growth.
Customer financing. CoreWeave’s share and bond prices declined in mid-October amid concerns about AI infrastructure borrowing. Financing pressure could affect customer budgets, although that episode does not establish canceled Nvidia orders.
Required returns. The 10-year Treasury par yield was 5.15% on October 19. Higher discount rates reduce the present value of future profits when other assumptions remain unchanged.
What the Forward Earnings Multiple Shows
Financial Beings’ October 20 workbook reports an unlevered forward P/E of 26.22 times: enterprise value divided by forecast after-tax operating profit. It uses FY2027 consensus inputs, rather than a matched next-twelve-month period, and differs from share price divided by forecast EPS.
The workbook flags possible nonrecurring income in its consensus inputs. This forecast-based multiple therefore needs caution. A lower multiple can reflect higher profit expectations; its apparent attractiveness still depends on whether those expectations are achieved.
The operating approach adjusts the valuation for cash and debt, helping distinguish the business from its financing structure. It does not remove uncertainty about demand, margins or the accounting adjustments behind forecast profit. Readers should therefore carefully compare the multiple with the earnings period it actually uses and avoid treating it as directly interchangeable with conventional forward P/E figures from other providers.
Conservative Base and Growth Scenarios
The sensitivity fixes the operating hurdle rate at 10%. Residual operating income means after-tax operating profit remaining after charging for capital employed. The starting profit base is FY2026, ended January 25, 2026, rather than the latest twelve months or FY2027 consensus.
Conservative covers 2%–4% perpetual growth, Base uses 5%, and Growth covers 6%–8%. These labels identify assumptions, not probabilities. The table preserves the workbook’s values and compares them with its $217.09 reference price.
| Scenario | Perpetual ReOI growth | Estimated value per share | Value as % of $217.09 price |
| Conservative | 2% | $60.87 | 28.04% |
| Conservative | 3% | $68.63 | 31.61% |
| Conservative | 4% | $78.98 | 36.38% |
| Base | 5% | $93.48 | 43.06% |
| Growth | 6% | $115.22 | 53.07% |
| Growth | 7% | $151.45 | 69.76% |
| Growth | 8% | $223.92 | 103.15% |
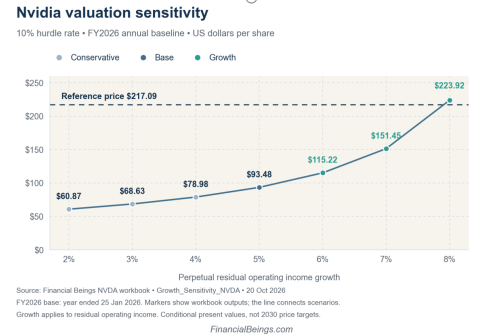
The Base scenario supports $93.48 per share, about 43% of the reference price. Within Growth, 7% supports $151.45 and 8% supports $223.92, approximately 3% above the reference price. Under this annual baseline, valuation support appears only near the upper end of the range.
Increasing perpetual growth from 7% to 8% raises value by approximately 48%. Sensitivity increases as growth approaches the 10% hurdle rate. The model requires approximately 7.94% perpetual residual operating income growth to justify the reference price under this baseline. That is a conditional growth requirement, not a revenue forecast.
Conservative still assumes expansion from the starting profit base. It does not model a major profitability decline. Updating earnings or operating capital can materially change every scenario and the implied growth requirement.
Perpetual growth extends beyond 2030, so the table cannot describe a specific path over the next four years. A business might expand rapidly initially and then mature, or experience interruptions before recovering. This single-stage calculation compresses those possibilities into one continuing growth assumption. Its practical role is to show how valuation changes with assumptions, while the business discussion identifies what could challenge their future durability.
Method: equity value equals net operating assets plus anchored residual operating income divided by (the hurdle rate minus growth), less net debt. Divide by current shares for value per share. Anchored residual income is treated as the first projected year. Source: Financial Beings’ October 20, 2026 workbook, Results and Growth_Sensitivity_NVDA sheets.
What to Watch Next
Nvidia scheduled its next results call for November 17, 2026. Watch revenue against the $108 billion guidance midpoint and gross margin against 74.0%, plus or minus 0.5 percentage points. Rubin execution, China restrictions and customer financing also deserve attention.
Compare cash generation with profit and consider working capital requirements. If operating capital grows faster than sustainable profit, residual operating income can lag revenue. The outlook through 2030 depends on both business execution and whether the valuation’s starting earnings base remains representative.
About the publisher: learn more about Financial Beings and its research background before interpreting the assumptions and conclusions presented in this valuation article.
For informational purposes only; not investment advice. Market references are dated October 19, 2026. The valuation workbook is dated October 20. Company results, guidance, consensus forecasts and valuation assumptions describe different measures and periods.







Comment