There are places in every home that WiFi cannot reach, usually referred by techies as dead zones. It can be an incredibly frustrating phenomenon, especially if you don’t have a WiFi heatmapper like NetSpot to help sort out dead zones.
If you have been struggling against weak signals, which usually disrupts your flow as you carry out your day-to-day activities, your wireless network may not be entirely blameless. But another possibility could be that you may be seated right in the middle of a dead zone. You cannot detect this with your naked eyes unless you use a WiFi heat map.
What is a WiFi Heat Map?
A WiFi heat map is a highly detailed and explicit heat map that is laid out in glaring colors that immediately reveal the spots with weaker and stronger wireless signal strength. As a collection of WiFi signal strength readouts, this will enable you to position yourself in the best spot in order to maximize the signal strength.
Seeing areas with weak wireless clearly visualized on a heat map also makes it easy for you to work out what exactly is interfering with the wireless signal. Sources of wireless signal interference could be obstacles like furniture, electrical appliances or gadgets, thick concrete walls, and even other wireless networks nearby.
With NetSpot, the #1 WiFi analysis tool, and the most extensive heatmapper app, you can create a WiFi heat map without having to break the bank or imbibe any special knowledge.
How to Create a WiFi Heat Map
Creating a WiFi heat map with NetSpot is a walk in the park, barring a few technicalities that you should be able to handle. For this exercise, you will need the following:
- The NetSpot app
- A Windows laptop or MacBook
- A plan of your office or home (this is optional)
Follow the steps outlined below:
Step 1: Begin with a New WiFi Site Survey
Launch NetSpot and then switch over to ‘Survey’ mode. Click the ‘Start a new survey’ tab. You will be required to supply the name of your survey project, zone, and area type. Providing this information will help you regulate the precise radii of each measurement.
You can limit the number of samples to take by selecting the correct setting for your space. This will also boost the accuracy of the results you come up with.
Step 2: Create or Upload a Map of Your Area
It is recommended that you have a map of your area for this exercise. If you do, click the ‘Load from file’ tab, and the map will be loaded onto the heat mapping tool.
However, if you don’t have a map for one reason or another, that is no problem at all. NetSpot has a feature that allows you to sketch or draw a map (for macOS only) – simply click the ‘Draw it’ tab. You can also start with the ‘Sample map’ option.
Step 3: Launch the Heat Mapping Procedure
Get your computer to a specific on the empty map and mark up your estimated location. A small dot will then appear when you do this.
Get yourself to a corner and start moving zigzaggingly through space you have measured. Mark your new location on the map after every few feet you cover. It’s a start-stop-start process throughout the space until you cover the entire area.
Step 4: Evaluate the Results
Whenever you pause when carrying out the heat mapping process, click the ‘Stop scan’ tab. And when you are ready, you can pick up right from where you left off.
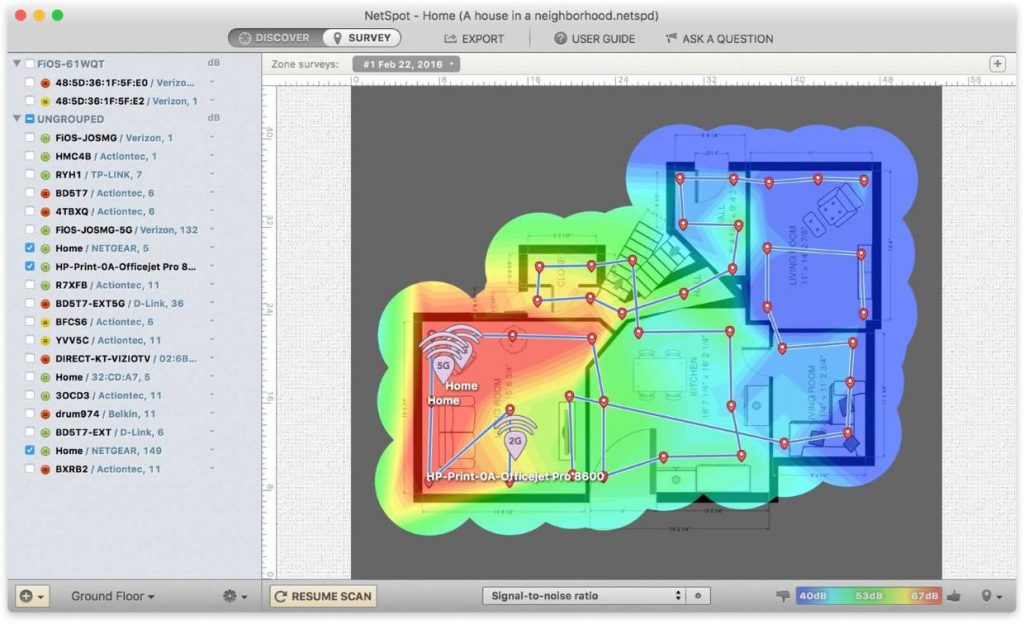
When you are done with the entire heat mapping process, click the Access Point right on the map in order to display the heat map signal for that particular Access Point. The strongest wireless signal is denoted with the ‘green’ color while the ‘red’ color denotes the weakest.
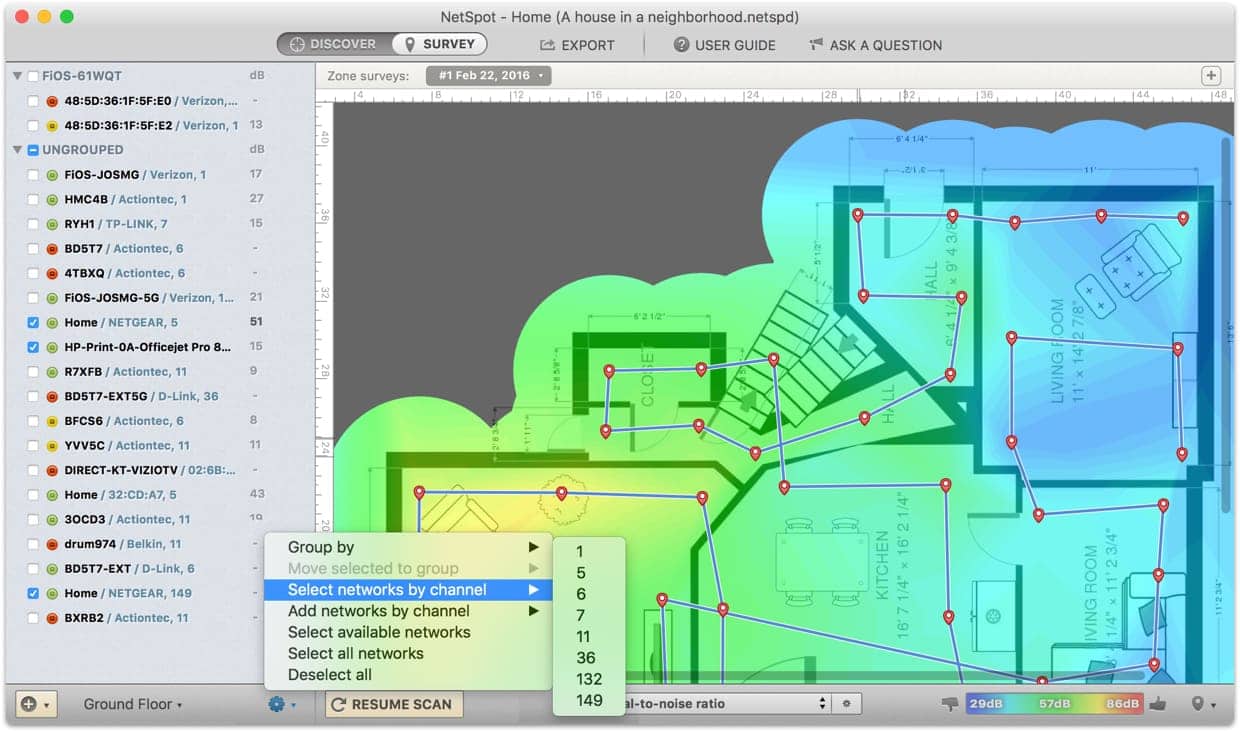
The panel located on the left-hand side will readily display all Access Points that your computer could discover. You can always switch off Access Points from neighboring networks whenever you need to do so.
Step 5: Save the Heat Map
Check out all the available visualizations in order to evaluate the entire parameters of your wireless network. You can save the wireless heat map by selecting ‘Survey’ and then ‘Save’ right from the top menu bar. The free version of NetSpot will not allow you to export or even print the surveys unless you upgrade to very affordable versions.
How to Find WiFi Dead Zones
As mentioned earlier, your finished heat map uses color to depict areas of strong and weak signals. When you move from green – which implies excellent wireless signal – to warmer colors, the signal becomes weaker. Yellow is still considered good signal strength, but orange is weaker than yellow while red is much weaker than orange.
On the heat map, red areas will be far from the WiFi router. But don’t be surprised to come across other unexpected dead spots in spaces where you expect to find a relatively good signal. When you come across such issues, take a much closer look at these areas in order to figure out why this is so.
Once you find out what is wrong, you should make amendments or adjustments and then create a new wireless heat map to see if the solution worked. NetSpot is the WiFi heat map software you need to help you work towards a highly optimal WiFi setup.
How to Troubleshoot WiFi Issues
You can troubleshoot WiFi issues by performing a WiFi site survey with the NetSpot software.
Start by identifying the area you want to perform WiFi troubleshooting on and either draw a map of the area or upload an existing one to the NetSpot software.
Then carry on with the survey; ensure you take samples throughout the entire area. You will see the heat map visualization of the space when the survey is complete.
Conclusion
NetSpot is the #1 tool that accurately visualizes, troubleshoots, and optimizes issues with your WiFi network so that you can the most reliable and fastest connection all the time. The innovative mapping features of the best WiFi heatmapper can quickly identify dead zones in your wireless network’s coverage. This will enable you to easily optimize your router’s placement to avoid snags as much as possible.
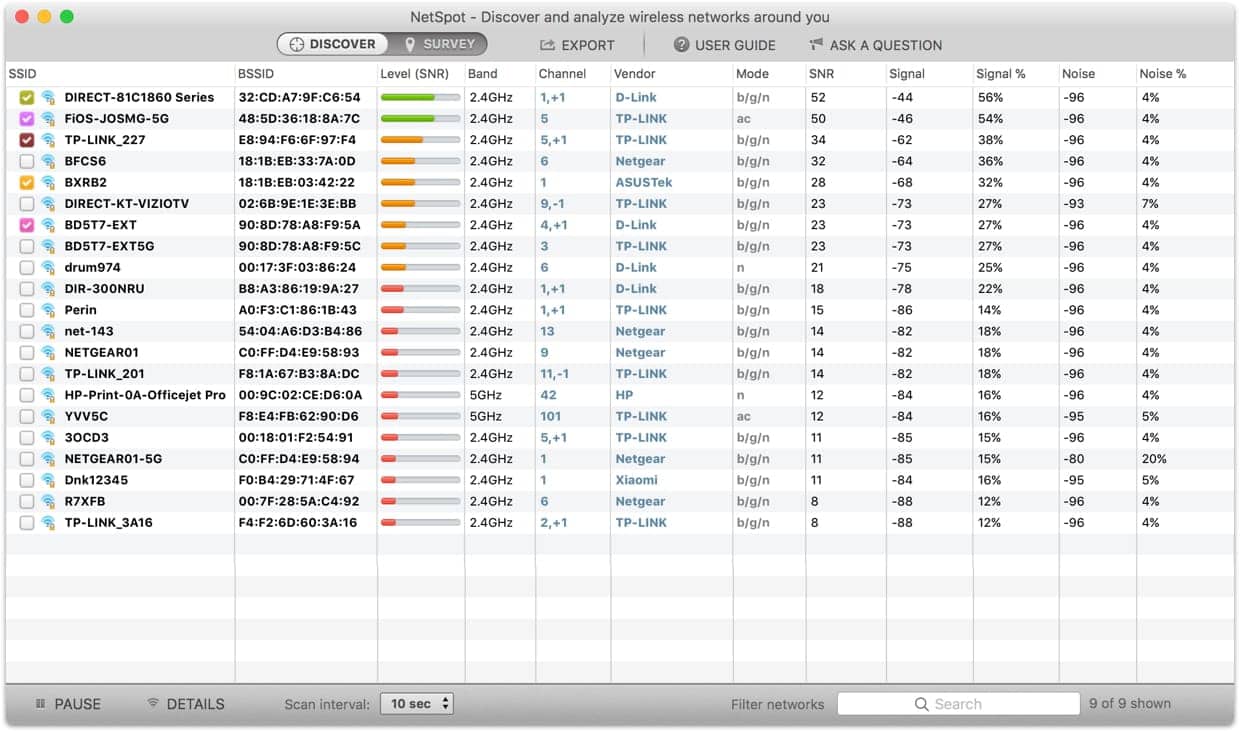
NetSpot is the user-friendly tool that creates the entire area’s heatmap, thereby enabling you to see the best places to position your router, settle down, and surf the web. You will be able to measure WiFi signal strength in order to see how strong it is with just a single click. And you can even watch your WiFi network in real-time as you move across either your office or home.