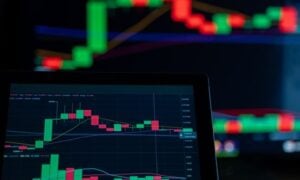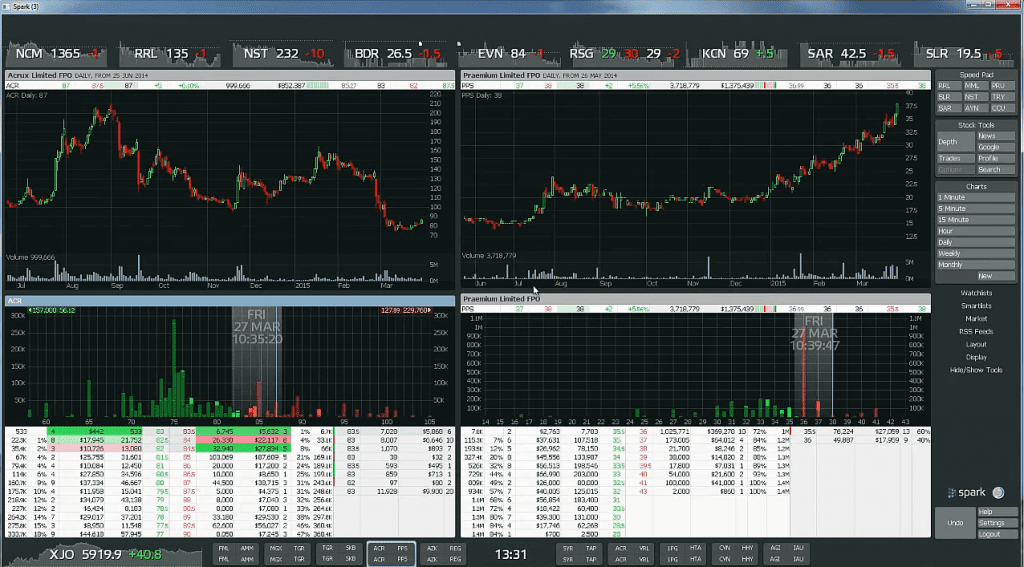
For traders to make profits on the forex market, there are market indicators that should guide them in making trading decisions and it is important to develop the skill of exploiting these indicators.
Each of the indicators offers unique functions and advantages. FP Markets, one of the top ten Indian brokers, grants its numerous clients easy access to these indicators (check FP Markets Review).
RELATIVE STRENGTH INDEX (RSI)
The Relative Strength Index (RSI) is fast becoming the most commonly used indicator among forex traders. Traders use it to measure the oscillation of prices over some time. In other words, it indicates to the trader the average gain or loss per period under consideration, thereby letting the trader know when to make a deposit or withdrawal.
MOVING AVERAGE CONVERGENCE DIVERGENCE (MACD)
This is another indicator popular among traders. It compares two Exponential Moving Averages (EMAs), providing traders with information on whether there is a contraction, expansion, or crossing over of these EMAs. With this information, traders can measure future price oscillations and know when to enter or exit the market.
COMMODITY CHANNEL INDEX (CCI)
This indicator compares present price to a baseline value. It evaluates the market using the moving average. It informs the trader of when prices will return to an adapting mean value. With this, the trader knows when to enter the market and prevent possible losses or a mistimed purchase. More importantly, it shows when securities are overbought or oversold.
BOLLINGER BANDS
When a trader wants to measure the volatility of prices in the market, Bollinger Bands is the right indicator to watch. It helps the trader monitor the variation of prices over a certain period: such as when volatility increases or drops. It also reveals which securities are overbought or oversold. However, Bollinger bands is not meant for trending markets because it only works great when the currency pair is trading within a range. It also needs confirmation from other indicators.
STOCHASTIC
This momentum indicator focuses majorly on identifying overbought and oversold securities in a zone. Traders looking to pick out areas they can make profits use this indicator to predict which location a reversal will occur. For example, when the price skips to above 70, there will be a probable reversal, and when it runs below 30 levels, a bullish reversal.
ICHIMOKU KINKO HYO
This is like an all-in-one indicator. It provides information on every angle of the market. A bearish trend is indicated when the price is trading below the Kumo Cloud, and a bullish trend when the price is above it.
FIBONACCI
This indicator provides close to the most accurate direction the market is going. With its golden ratio of 1.618, its most outstanding feature, traders can monitor market reversal and the areas they can pounce on to take in some profits.
All Indicators have their unique methodology. The final choice is left for the trader to make. And a trader’s own goals or expectations determine the particular indicator that meets them.