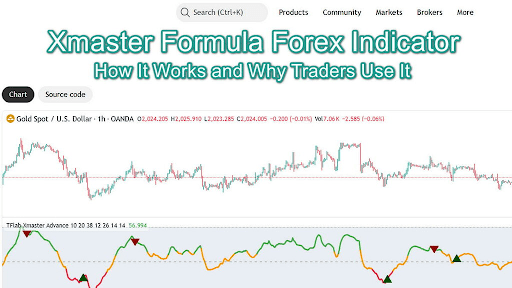
The Xmaster Formula Forex indicator has become one of the most widely used analytical tools among retail traders who want a simple, visual method for spotting potential market reversals.
Although its internal logic is based on a blend of advanced algorithms, its interface remains beginner-friendly, making it attractive for scalpers, day traders, and long-term analysts alike.
This article takes an in-depth look at how the Xmaster Formula works, what makes it different from other indicators, how to interpret its signals, and how traders use it across MetaTrader 4, MetaTrader 5, and TradingView.
What Is the Xmaster Formula Forex Indicator?
The XHMaster Forex indicator is a hybrid technical tool designed to analyze market momentum, trend strength, and overbought/oversold conditions.
Instead of relying on one single metric, it extracts information from several traditional indicators and merges them into one unified output.
Behind the scenes, Xmaster Formula incorporates elements of:
- Moving Averages
- MACD components
- Bollinger Band logic
- Additional smoothing and volatility filters
These combined algorithms allow the tool to highlight moments when price behavior becomes stretched or when the trend shows signs of weakening.
Despite the complexity behind its calculations, the indicator visually simplifies everything into color-coded buy and sell signals, making it practical even for traders with minimal technical analysis experience.
Why Traders Prefer the Xmaster Formula Forex Indicator
The Xmaster Formula Forex indicator is popular for several reasons:
- Works on Any Timeframe: Whether you’re scalping on the 1-minute chart or analyzing the weekly trend, the indicator adjusts smoothly without requiring major tweaks;
- Highly Suitable for Volatile Pairs: Many traders use it during the London trading session, when currency pairs such as GBP/USD, EUR/USD, and GBP/JPY show their strongest movements;
- Friendly for Beginners: Because the signals are simple (green for buy, red for sell), newcomers can start using it without studying advanced chart patterns;
- Adaptable to Many Trading Styles: The indicator is used by scalpers, day traders, swing traders and long-term position traders. Its flexibility is considered one of its biggest strengths.
Understanding Overbought and Oversold Zones
One of the strongest aspects of the Xmaster Formula Forex indicator is its ability to detect exhaustion zones.
- When the Market Is Overbought: If the indicator turns red near the top region of the window, it suggests that buyers may be losing momentum and sellers could soon take control;
- When the Market Is Oversold: A green signal near the bottom zone suggests that the market might be undervalued and due for a bounce;
While these hints are valuable, experienced traders rarely rely on the Xmaster Formula alone. The indicator is strong, but it can occasionally generate false signals, especially in sideways or range-bound markets.
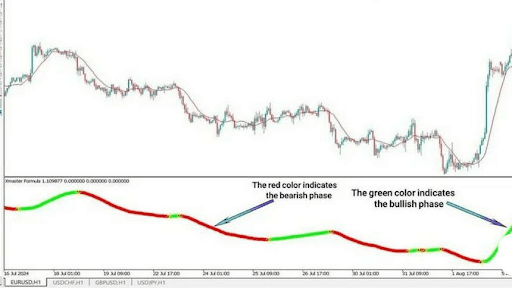
The red and green color on the Xmaster Formula show overbought and oversold zones
Best Time to Use the Xmaster Formula Forex Indicator
Although functional during all sessions, the indicator performs at its best when volatility increases.
Most Effective Sessions:
- London session (ideal)
- New York session (strong movements, especially after overlap)
During these hours, breakouts, reversals, and trend continuation patterns become more obvious, increasing the reliability of Xmaster Formula’s signals.
How To Improve Accuracy: Recommended Indicators to Combine With Xmaster
Many traders increase the reliability of the Xmaster Formula Forex indicator by pairing it with additional tools. Here are the three most common choices:
Relative Strength Index (RSI)
The first and most common tool used alongside Xmaster is the Relative Strength Index (RSI). RSI is one of the simplest yet most reliable momentum oscillators, designed to measure whether the market is overbought or oversold.
When RSI climbs above the 70 level, price is generally considered overbought, meaning upward movement may be losing strength. When it falls below 30, the market is considered oversold and may be preparing for a reversal. This makes RSI a perfect confirmation tool for Xmaster’s signal arrows.
For example, if Xmaster generates a buy alert but RSI still sits above 70, it signals that the market is too stretched to the upside and entering a long position may be risky.
In the opposite case, if Xmaster indicates a sell but RSI is rising from oversold territory, the bearish reversal is unlikely to hold, and waiting becomes the safer choice.
Using both indicators together helps filter out weak or premature signals, especially in volatile markets where false moves are frequent.
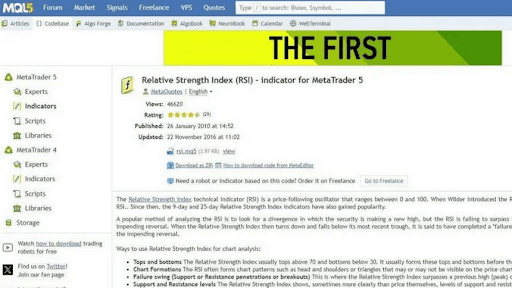
The Relative Strength Index (RSI) is a reliable oscillator that goes well with Xmaster Formula indicator
Average Directional Index (ADX)
The Average Directional Index (ADX) is another excellent companion for the Xmaster Formula indicator. ADX does not show trend direction; instead, it measures how strong a trend is.
Readings above 25 suggest strong, trending conditions, while readings below 20 indicate weakness or sideways movement. This is crucial when interpreting Xmaster signals because the indicator can occasionally generate reversal alerts in markets with extremely low volatility.
A signal during a ranging period is typically unreliable and more prone to failure. For example, if Xmaster issues a buy or sell signal while ADX is below 20, it suggests the market lacks momentum, making any entry riskier.
On the other hand, if Xmaster’s arrows appear while ADX is climbing above 25, traders can be more confident that momentum is supporting the move. When ADX rises above 40, it often points to an exceptionally strong trend, helping traders determine whether they should ride the trend or lock in profits.
Bollinger Bands or Breakout Oscillators
Another highly effective tool to combine with Xmaster is Bollinger Bands or breakout-based oscillators. Bollinger Bands track volatility and reveal whether price is expanding, contracting, or preparing for a breakout.
When the bands widen significantly, volatility is increasing and momentum is strengthening. When they contract, the market is entering a range or consolidation. This behavior pairs well with Xmaster because it clarifies whether a signal is part of a real trend or just noise.
For instance, if price breaks above the upper Bollinger Band and Xmaster simultaneously flashes a buy signal, traders have more confidence that a genuine upward breakout is forming rather than a temporary spike.
Likewise, if price consistently taps the lower band while Xmaster signals a potential reversal, it may indicate that bearish momentum is exhausting.
These confirmations help traders decide whether they are catching the beginning of a move or simply reacting to random price swings. Breakout oscillators based on Bollinger Band logic can further refine signal strength by measuring how intensely price pushes outside the bands.
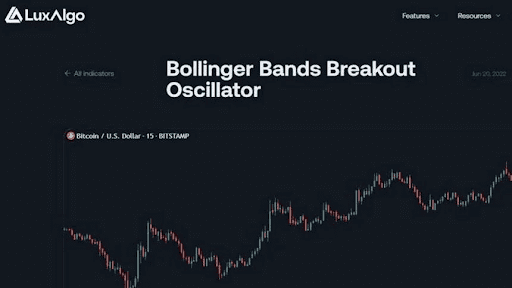
Use Bollinger Bands or Breakout Oscillators alongside Xmaster Formula indicator
Practical Tips for Using the Xmaster Formula Forex Indicator
To get the most out of the tool:
- Avoid trading every signal; only take those supported by price action;
- Watch candlestick formations for added confirmation;
- Use stop losses to avoid unexpected reversals;
- Don’t rely on the indicator alone; the best strategies combine multiple confirmations;
- Test on a demo account first, especially if you’re new to algorithm-based indicators;
The indicator is powerful, but discipline and risk management are what make it effective in real-world trading.
Final Thoughts
The Xmaster Formula Forex indicator is a versatile and accessible tool for identifying trend reversals, overbought/oversold conditions, and market momentum shifts.
Its easy interface makes it suitable for beginners, while its adaptability benefits professional traders who want a clean, visual decision-making tool.
While it works extremely well on highly volatile pairs, especially during the London session, it performs best when combined with additional indicators such as RSI, Bollinger Bands, or ADX.
As with any analytical tool, the Xmaster Formula is not a standalone strategy, but when used correctly, it can become a reliable part of a smart trading system.
FAQ
- Is the Xmaster Formula Forex indicator suitable for beginners?
Yes, it’s beginner-friendly because its signals are simple and color-coded. Traders don’t need advanced technical knowledge to start using it effectively.
- Does Xmaster Formula work on both MT4 and MT5?
Yes, the indicator is available for MetaTrader 4 and MetaTrader 5, and it performs similarly on both platforms. Many custom versions also exist for TradingView.
- Can I use the Xmaster Formula alone without any other indicators?
You can, but it’s not recommended. Pairing it with tools like RSI, ADX, or Bollinger Bands significantly improves accuracy and reduces false signals.
- What type of market conditions does Xmaster perform best in?
It works best during high-volatility sessions, especially the London and London–New York overlap. Strong momentum makes its reversal signals more reliable.
- Does the Xmaster Formula repaint signals?
Most versions do not repaint once the candle closes, but modified or unofficial versions might. It’s best to use a verified, stable release from a trusted source.