Introduction: Why This Discussion Matters Now
As the world becomes increasingly data-driven, service providers, banks, financial institutions, government sectors, and cloud operators rely heavily on real-time system visibility. Monitoring has become a critical backbone for performance, reliability, and compliance. When operations and monitoring teams gather to assess system health, they typically use a multitude of tools: one for storage, another for infrastructure management, others for networking, virtualization, load balancing, and beyond. Each tool provides a narrow slice of telemetry, tailored for specific layers—but business stakeholders struggle to gain a comprehensive view.
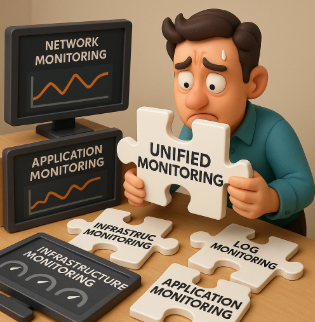
The business side expects KPIs and actionable insights, not technical logs and metrics. They demand a unified monitoring view—a single screen where decision-makers can track real-time performance across all systems, legacy or modern, and take timely action. This drives a widespread organizational desire to adopt a single monitoring product that replaces the fragmented stack.
However, when this strategy is rolled out, it often turns into a nightmare. The very attempt to consolidate everything under one platform introduces operational friction, implementation challenges, governance risks, and reduced effectiveness. This article explores why the dream of a single-pane-of-glass tool is not just impractical but potentially damaging—and why federated observability remains the smarter path forward.
🔹 Executive Summary: Top 5 Reasons Enterprises Can’t Rely on One Monitoring Tool
- No Single Tool Excels Across Domains
Different monitoring layers—application, network, infrastructure, logs, and cloud—require specialized tools for deep, actionable insights. - Tool Consolidation Often Leads to Lock-in
Relying on a single vendor increases risk, reduces flexibility, and stifles future innovation and adaptability. - Federated Monitoring + AIOps Outperforms Monoliths
Federated systems, when integrated with cross-domain AI correlation, offer better root cause analysis and significantly lower MTTD. - Data Centralization Without Tiering = Explosive Cost
Petabytes of telemetry without a tiered hot/warm/cold storage strategy can lead to massive cost overruns and data gravity issues. - Unified Dashboards ≠ Unified Tools
Business stakeholders need a unified view, but IT requires specialized tools. Orchestrating diverse tools is more effective than forcing uniformity.
The Myth of Cost Savings
Tool consolidation might reduce surface-level costs but triggers deeper losses:
- Rebuilding lost features
- Dashboard rewrites
- Retraining cycles
- Lowered team productivity
Expanded Real-World Failure:
One large-scale enterprise made the strategic decision to eliminate over twenty-five different monitoring tools each previously responsible for specific layers of infrastructure, application performance, networking, and security and replace them with a single, all-encompassing platform marketed as an “enterprise-grade” observability solution. But they failed at it due to the three main challenges;
- Challenge 1: User Resistance: Expert users—especially those managing complex infrastructure or performance—were reluctant to abandon granular, low-level visibility tools. Governance and risk teams flagged implementation conflicts.
- Challenge 2: Agent Pushback: The previous solution was agentless. The new one demanded agent installation, triggering rejection from database, server, and application owners due to security and resource constraints.
- Challenge 3: Post-Implementation Disillusionment: Even after overcoming rollout hurdles, monitoring lacked the required depth. Technical teams grew frustrated. Despite spending 15 months and investing heavily in licensing and consultants, the unified platform couldn’t deliver. The organization reverted to a hybrid model. Cost overrun: 22%.
Stat: 73% of enterprises that consolidate revert to federated models within 18 months (IDC, 2023).
- No Tool Excels in Every Domain
Excellence in observability is domain-specific. Infrastructure monitoring, log analysis, application tracing, and RUM (real user monitoring) demand tailored toolsets. Force-fitting one tool leads to shallow insights, alert fatigue, and reduced trust from engineering teams.
- Integration Gaps and Data Gravity
Even so-called all-in-one platforms need plugins, agents, APIs, or exporters to ingest external telemetry. Integration often breaks, context is lost, and signal-to-noise ratios worsen.
Real-World Case: eBay
eBay stands as a prime example of how an enterprise can transform operational challenges into success stories through innovation. Faced with rising latency issues and increasing cart abandonment rates, eBay struggled with incomplete observability. Their existing monitoring platforms fell short of meeting evolving customer expectations and was unable to provide meaningful correlation between backend service failures and frontend user experience anomalies.
Recognizing the limitations, eBay adopted a more sophisticated observability strategy by integrating specialized distributed tracing and log correlation tools. This enhanced visibility enabled them to uncover previously hidden issues such as memory leaks in the checkout service and CDN throttling during peak traffic. By addressing these root causes, eBay not only improved system performance but also reinforced customer satisfaction and business continuity.
Solution: Implement tiered storage:
- Hot: Real-time metrics
- Warm: Indexed logs for 30 days
- Cold: Archived telemetry This balance controlled costs and ensured rapid incident response.
- Vendor Lock-in and Risk Exposure
When a single tool handles all observability, it introduces dependencies:
- Price hikes strain budgets
- Acquisitions or sunsets disrupt operations
- Custom scripts become tech debt Tool diversity promotes resilience and innovation.
- Enterprises Are Not Homogeneous Environment
Enterprise ecosystems span legacy systems, cloud-native apps, SaaS environments, container clusters, and edge devices. Each emits unique telemetry: logs, events, traces, metrics. Expecting one tool to normalize and correlate them all, in real-time, is unrealistic.
Real-World Example 3:
This is the example of a Tier-1 financial institution where the business expected and planned to go for the single solution so they did an initial exercise to replace with one Enterprise AIOPS/Monitoring tool but at very early stage they decided that this could be very hard route where millions of transaction has to be monitored, normalized , prioritize and correlate.
Therefore, this Tier-1 financial institution initially opted only an APM solution to robust application insights but lacked visibility into the underlying database and network. Therefor By combining it with dedicated infrastructure, database and log tools, they reduced MTTD by 40% and gained a unified operational perspective.
If their approach would be a one single solution they may not achieve the what currently they have achieved.
- Multiple Teams, Multiple Views
NOC, DevOps, App Owners, Security, and Executives all need distinct dashboards and alerting logic. No single view satisfies all personas. Contextual relevance trumps uniformity.
6.5 Observability Requires Security Context
Incidents often mask security issues:
- API spikes could indicate DDoS
- Permission drift shows in error logs
Example:
A retailer uncovered $2M in credit card fraud after:
- Seeing latency spikes (APM)
- Identifying IAM drift (CSPM)
- Detecting suspicious log patterns (“CardTest”) via SIEM This cross-domain correlation prevented wider breach.
- Tool Consolidation Slows Innovation
Open standards (OpenTelemetry), adaptive baselining, and ML enhancements emerge quickly. Niche tools adopt them first. Unified platforms struggle to keep pace.
- Federated Monitoring Is the Future
A federated model means choosing the best tool per layer and unifying outputs using:
- Common data formats
- Central data lakes
- Correlation engines
- Unified visualizations This approach blends specialization with coherence.
AIOps Synergy: The Intelligence Layer
Federated setups risk silos—unless stitched with ML.
Example:
A bank mapped:
- Disk IO alerts → JVM GC events → Payment API errors AI correlation identified cascading failures. Outcome: 65% faster MTTD (Gartner, 2024).
9. Unified Dashboards, Not Unified Tools
Executives want unified reporting. Engineers need specialized telemetry. Solve this with dashboard layers, API feeds, and service-mapping tools—not tool consolidation.
10. Continuous Measurement & ROI
Define observability KPIs:
- % of correlated alerts
- % of unactionable noise
- Time spent context-switching
- Pipeline latency
Then benchmark, optimize, and iterate.
Final Thought
The vision of a single monitoring tool is seductive but flawed. Enterprise-grade observability isn’t about convenience—it’s about capability. Real success lies in embracing a federated ecosystem stitched with AI, designed around the unique needs of every team, system, and signal.
Observability isn’t about choosing one tool—it’s about designing the right architecture.
Author Profile:
Name: Syed Umair Akhlaq
Email Address: umairakhlaque78@gmail.com