When you first look at a trading chart, it often feels overwhelming, with candlesticks everywhere, sharp moves up and down, and no clear structure. I remember staring at the screen for hours, waiting for some hidden order to appear, but it never did.
That changed when I learned about trendlines. Far more than a simple line across the chart, a trendline reveals the market’s proper direction, shows the strength of momentum, and highlights potential breakout points. It transforms random price movements into a story you can actually follow.
In this guide, H2T Funding will break down what a trendline is, why it’s essential, and how you can apply it right now to trade smarter and with purpose.
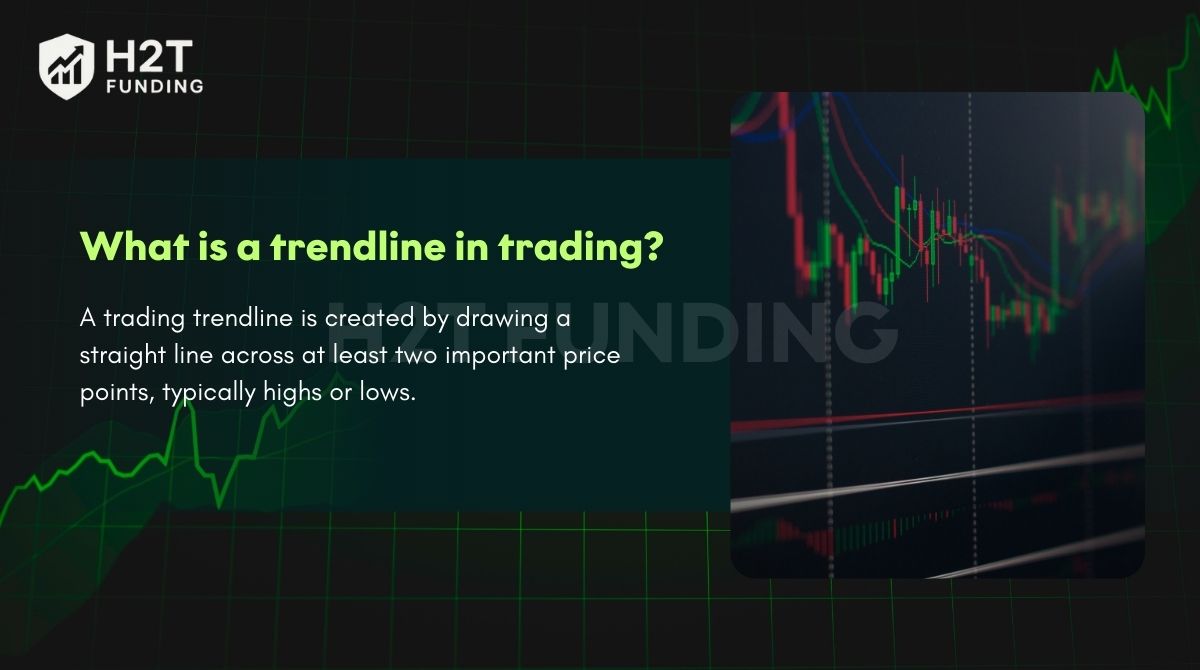
1. What is a trendline in trading?
A trading trendline is created by drawing a straight line across at least two crucial price points, typically highs or lows. It graphically illustrates market movement and momentum, helping traders determine whether prices are trending up, down, or sideways.
At the most basic level, a trendline is a line drawn through significant highs or lows to outline the market’s overall movement. But its significance reaches further. Think of price movement as a ball that keeps bouncing upward, one step at a time.
On its own, the movement seems unpredictable. But once you draw a line along the lows of each bounce, a clear path appears, you can see both the rhythm and the momentum carrying it forward.
2. The meaning of a trendline for traders
Drawing a line on a chart is easy, but the real question is, do you understand what it’s saying? A properly drawn trendline is not decoration; it’s a direct insight into how the market is behaving and where it could be headed.
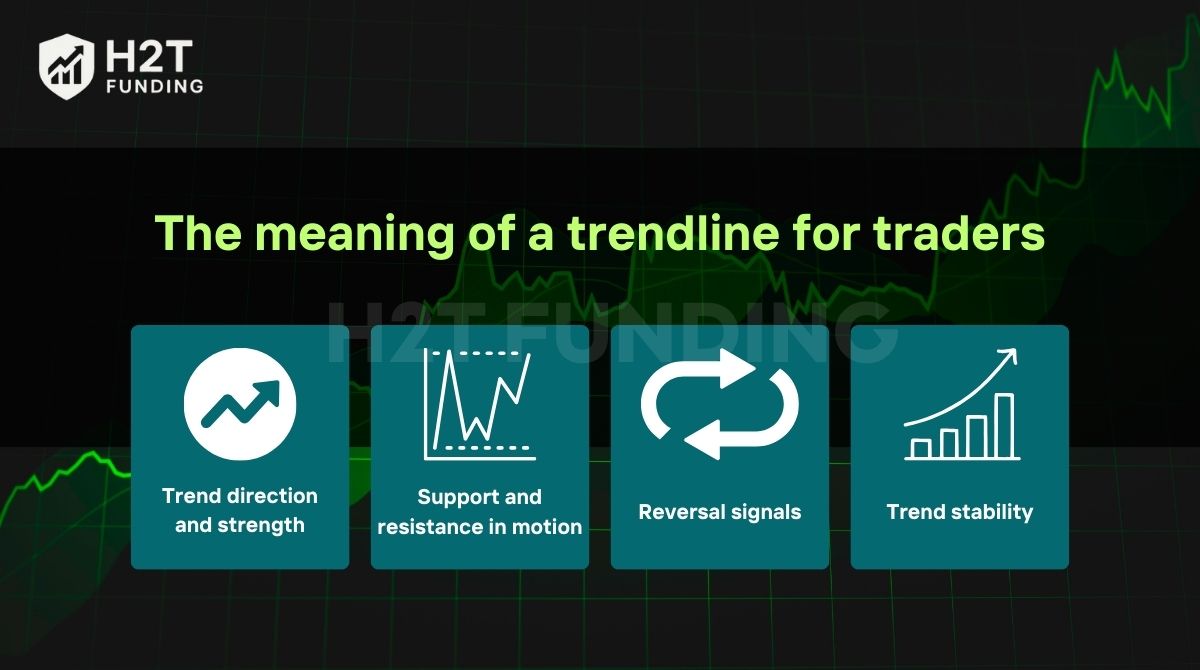
From my experience, a trendline speaks in four key ways:
- Trend direction and strength: An ascending line confirms bullish momentum, while a descending one signals bearish control. The angle matters; a steep slope shows intensity but also fragility.
- Support and resistance in motion: In an uptrend, the line acts like a rising floor where price finds repeated support. In a downtrend, it becomes a ceiling that pushes the price lower.
- Reversal signals: When price breaks sharply through a well-respected line, it often marks a shift in momentum. This isn’t just market noise; it’s a signal that your strategy needs adjustment.
- Trend stability: A near-vertical line may look powerful, but it rarely lasts. Sustainable trends are built on steadier, more moderate angles.
Personally, I see trendlines as a trader’s filter; they strip away the distractions of short-term price noise and show me the market’s rhythm. While no tool is flawless, reading trendlines correctly has consistently helped me decide whether to enter, hold, or step aside, especially in high-pressure tests.
3. The main types of trendlines in trading
Every trendline reflects market psychology; it serves as a visual record of how buyers and sellers are competing for control. Knowing how to read them means no more guessing, only focused, purposeful trading. Among the different variations, two core types form the foundation for all traders: the uptrend line and the downtrend line.

The uptrend line
An uptrend line is created by linking at least two, and ideally three, rising lows in sequence on a price chart. This rising line acts as dynamic support, showing that buyers are consistently stepping in to keep prices moving higher.
Consider this: a market dips, tempting you to believe momentum is fading, but then rebounds to a new high. When this repeats, it signals strength; each pullback is simply fuel for the next leg up. By linking those lows, you create a clear path of confidence for buyers.
Here’s how professionals use it:
- Confirming strength: As long as the price respects the line, buyers remain in control.
- Spotting entries: Pullbacks to the line often present attractive buying opportunities.
- Managing risk: A stop-loss just below the line keeps you protected. If the price breaks through, the trend may be coming to an end.
The downtrend is considered active so long as the market fails to push above the line.
The downtrend line
A downtrend line, in contrast, is drawn by connecting lower highs. Sloping downward, it functions as dynamic resistance, marking where sellers repeatedly push prices lower.
In a downtrend, rallies often fail to reclaim prior highs. By linking those points of failure, you create a roadmap showing that selling pressure continues to dominate.
Here’s how traders apply it:
- Confirming bearish control: A downward-sloping line is clear evidence that momentum favors sellers
- Identifying short setups: When price rallies back toward the line and stalls, it often presents an opportunity for a sell entry.
- Protecting capital: Stops are usually placed just above the line; if price breaks through, the trend could be reversing.
As long as the market fails to break above the downtrend line, the bearish trend is considered alive and well.
4. Simple steps to draw a trendline correctly
Drawing a trendline may seem straightforward, but doing it right unlocks real clarity in the chaos. When you connect meaningful price points and see the line hold through multiple tests, it becomes proof that you’re reading the market with purpose and precision. That’s when confidence starts to replace confusion.
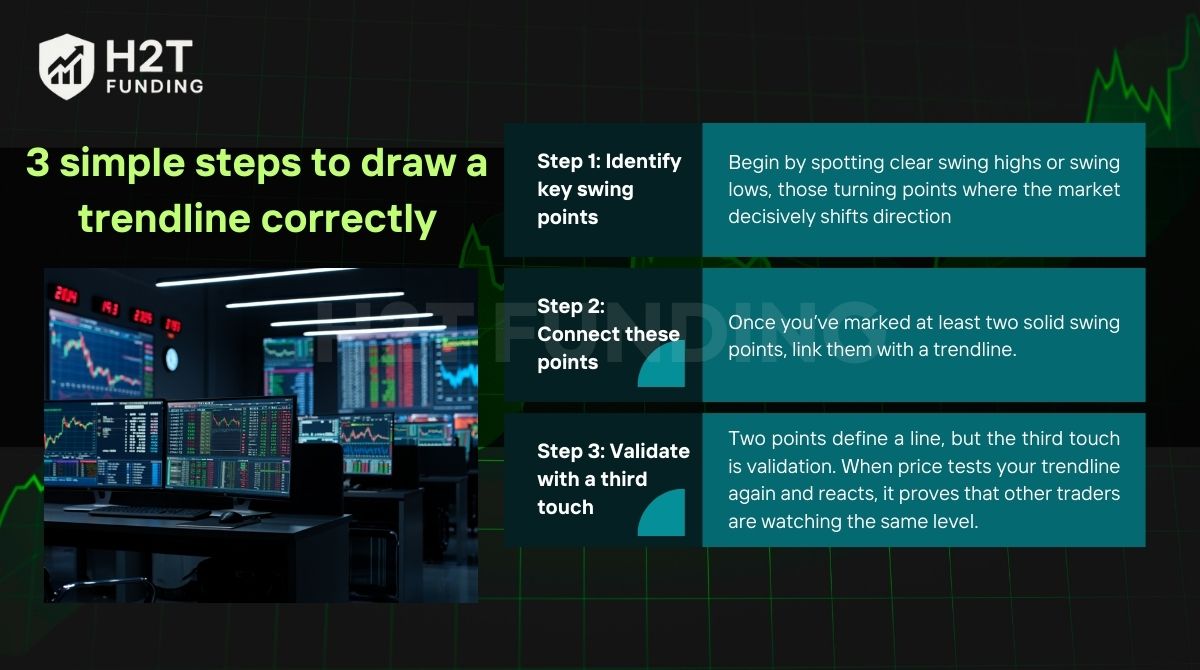
Step 1: Identify key swing points
Begin by identifying clear swing highs or swing lows, those turning points where the market shifts direction decisively.
- In an uptrend, look for higher lows
- In a downtrend, focus on lower highs.
Checking higher timeframes (like the 4-hour or daily chart) ensures you’re using significant levels rather than random intraday noise.
Step 2: Connect these points
Once you’ve marked at least two solid swing points, link them with a trendline.
- In an uptrend, connect the rising lows.
- In a downtrend, connect the falling highs.
Extend the line forward to project potential future reactions. When you later see price respect that line, it’s a powerful confirmation that your analysis aligns with market behavior.
Step 3: Validate with a third touch
Two points define a line, but the third point is what validates it. When price tests your trendline again and reacts, it proves that other traders are watching the same level. That collective recognition adds weight to your analysis.
The more touches, the stronger the line’s reliability. Don’t stress about perfection; minor deviations are a natural part of the process. What matters is the overall respect of price to the line. A strong trendline flows with the market, and when it’s drawn correctly, you’ll know it instantly.
5. Two popular trendline trading strategies
Once you understand how to draw a trendline correctly, the next step is putting it into action. A trendline is not just a visual guide; it’s a decision-making tool that can create high-probability setups. Over the years, I’ve seen two strategies stand out as both practical and reliable: the bounce and the breakout. 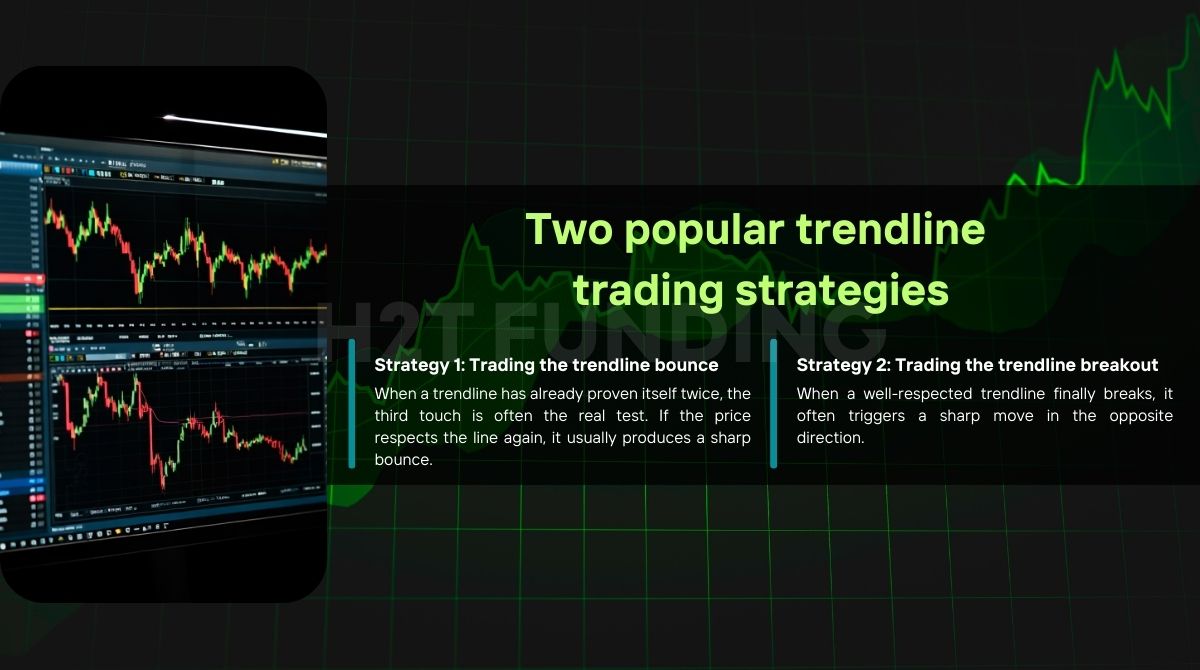
Strategy 1: Trading the trendline bounce (the “third touch” rule)
When a trendline has already proven itself twice, the third touch is often the real test. If the price returns to the line, it usually produces a sharp bounce. That’s not a coincidence; it’s the market showing collective belief in the level.
Here’s how I approach it:
- Identify a strong, valid trendline with at least two distinct points of contact.
- Be patient, wait for the price to return to the line instead of chasing.
- Look for confirmation before entering, such as a rejection candlestick or a bullish engulfing pattern.
- Protect your capital by placing a stop-loss on the opposite side of the line.
From experience, I’ve learned not all third touches are equal. A powerful rejection candle at the line is a strong signal. However, if the price drifts along with weak candles, that usually indicates that momentum is fading. Knowing when not to trade the third touch is just as important as knowing when to act.
Strategy 2: Trading the trendline breakout
A breakout isn’t just price slipping past a line; it’s the market signaling that the balance of power has shifted. When a well-respected trendline finally breaks, it often triggers a sharp move in the opposite direction.
My personal checklist looks like this:
- Start with a trendline that has been tested multiple times.
- Watch for a decisive close on the other side of the line.
- Either enter immediately after the breakout or wait for a retest, where the broken line acts as support or resistance
- Place stops beyond the opposite side of the line.
- Always check volume: substantial volume confirms conviction, while weak volume raises the risk of a false break.
Breakouts can deliver fast profits, which is why many momentum traders love them. But they’re also high-risk if you don’t manage position size and stops carefully. In my view, the breakout strategy rewards discipline; it punishes anyone chasing moves without a plan.
6. The difference between trendlines and channels
Trendlines and channels often appear side by side on a trader’s chart, but they’re not the same thing. Each serves a distinct purpose, and understanding the difference is what separates someone who just “draws lines” from someone who actually reads the market.
| Criteria | Trendline | Channel |
| Structure | A single straight line | Two parallel lines form a boundary |
| Purpose | Mark the dynamic support or resistance | Defines the entire price range of a trend |
| Usage | Trade bounces or breakouts from the line | Trade inside the channel (buy near support, sell near resistance) or trade breakouts beyond the range |
From my experience, a trendline gives you one side of the battle, either support or resistance. A channel, on the other hand, shows you the entire arena. By capturing both boundaries, it illustrates how price oscillates between buyers and sellers, giving you a fuller picture of the trend’s rhythm.
7. Key limitations and common mistakes to avoid when drawing a trendline
Trendlines are popular for a reason; they’re simple, visual, and often effective. But no tool is flawless. Misusing them or placing too much trust in a single line can lead to poor decisions quickly. To use trendlines wisely, it’s important to recognize their weaknesses and the common traps traders fall into.
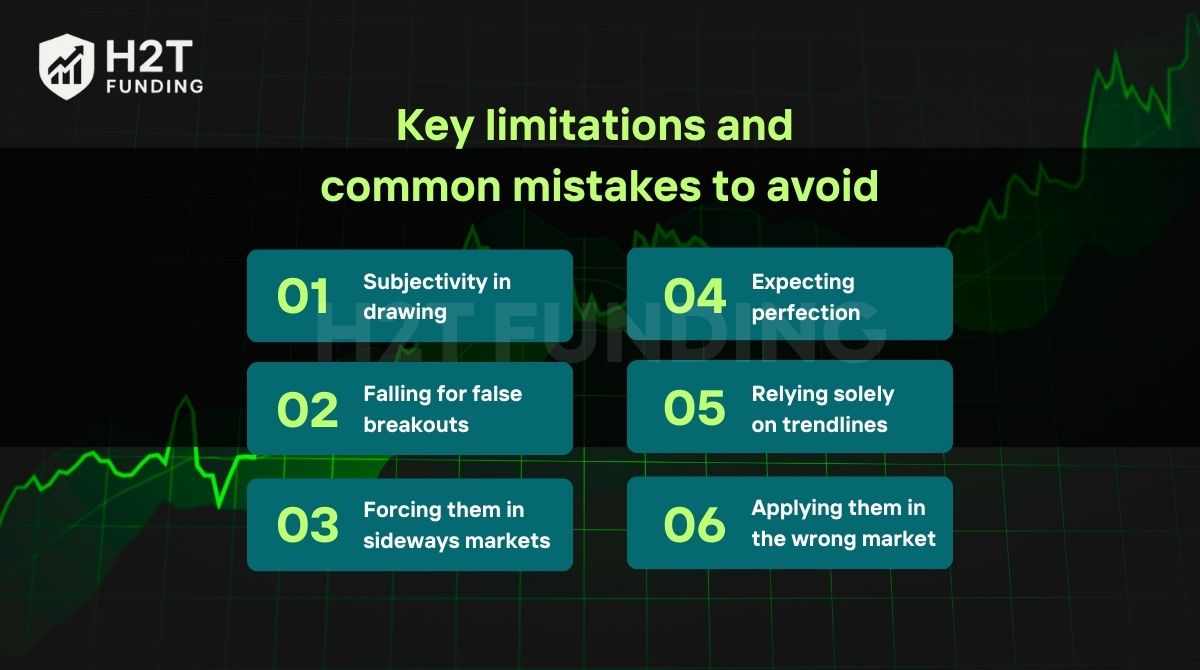
1: Subjectivity in drawing
No two traders will draw a trendline in exactly the same way. Even small differences in swing point selection can change the angle and interpretation. That’s why confirmation through multiple touches is essential.
2: Falling for false breakouts
Markets often fake a breakout, briefly pushing past the line before snapping back. Reacting too quickly can mean premature exits or losing trades. Always wait for confirmation before acting.
3: Forcing them in sideways markets
Trendlines thrive in trending conditions. In choppy or range-bound markets, they lose reliability and generate more noise than signals. In such cases, horizontal support and resistance lines are often more useful.
4: Expecting perfection
Many beginners assume the price will reverse at the exact pip of their line. They set stops too close and get shaken out by normal volatility. A smart trader gives trades a margin of safety around the line.
5: Relying solely on trendlines
A trendline should never be your only tool. Signals are stronger when supported by other indicators, like a confluence with a moving average, RSI, or volume.
6: Applying them in the wrong market
Using trendlines in conditions without a clear direction is misleading. Trendlines shine in trending markets, not when the price is stuck in consolidation.
The bottom line: trendlines are powerful, but they are not infallible. Treat them as part of a broader toolkit, combine them with other methods, and always pair them with disciplined risk management.
8. Frequently asked questions about trendlines
How do trendlines work in trading?
Trendlines act as visual guides for price direction. In an uptrend, they serve as a rising support level where price often rebounds. In a downtrend, they act as falling resistance, marking areas where rallies tend to fail. Traders rely on these lines to plan entries and exits more effectively.
When should you use a trendline?
Trendlines work best when the market is moving with a clear direction, up or down. They are most reliable on higher timeframes, such as the 4-hour or daily chart. In sideways or choppy markets, they lose accuracy and can generate misleading signals.
What is a trendline in the stock market?
In stocks, a trendline functions similarly to those used in forex or crypto. It connects key highs or lows to show the dominant trend, helping traders identify dynamic support and resistance and time their trades with more precision.
What does a trendline tell me?
A trendline reveals who controls the market, buyers or sellers. It shows the direction, strength, and structure of the move, and repeated respect of the line suggests it’s being recognized as an essential level by many traders.
How do I know if my trendline is valid?
A strong trendline should:
- Connect at least two, ideally three, major swing points.
- Be tested by price multiple times.
- Fit naturally into the market structure rather than being forced.
The more confirmations it has, the more reliable it becomes. A line with fewer than three touches is still hypothetical.
Do trendlines work in all market conditions?
No. Trendlines are most effective in trending markets. In sideways or range-bound conditions, price action is too erratic, and horizontal support/resistance zones, or oscillators like the RSI, tend to be more reliable.
How can I backtest a trendline strategy effectively?
Use historical charts with visible trends. Draw your trendlines without peeking ahead, then apply a consistent entry/exit method (such as bounce or breakout)—track results including win/loss ratio, risk/reward, and frequency of false signals. Platforms like TradingView with replay mode are great for realistic testing.
Do professional traders use trendlines?
Yes. Professional traders often use trendlines as part of their technical toolkit. While they combine them with other methods, such as moving averages, volume, or price action patterns, trendlines remain a core tool for identifying direction, momentum, and breakout opportunities.
9. H2T Funding – Connect traders with the right capital partners for long-term success
H2T Funding was founded in 2025 with a simple but ambitious vision: to empower traders worldwide by providing transparent, accurate, and trustworthy information about proprietary trading firms.
In an industry often clouded by misleading promotions and unclear rules, H2T Funding quickly established itself as a reliable partner, helping traders confidently navigate the complexities of today’s financial markets.
By simplifying access to capital and funding opportunities, the platform creates a fair environment where both beginners and experienced traders can scale their strategies sustainably.
To support its mission, H2T Funding provides traders with comprehensive resources, organizing them into clear categories. These include independent reviews, detailed analyses, comparison tools, and continuous updates, all structured to help traders at every stage:
- Budgeting Strategies: Methods to manage capital effectively.
- Cash Flow & Trading Strategies: Balancing Personal Finance with Active Trading.
- Prop Firm & Trading Strategies: Insights for Navigating Challenges and Scaling Accounts.
- Prop Firm Review: Independent evaluations of top firms worldwide.
- Prop Firm Rules: Breakdown of conditions, profit splits, and restrictions.
- Resources: Essential guides, tools, and updates to support traders daily.
Behind this trusted platform is a team of seasoned professionals who combine expertise with a deep understanding of global financial markets.
- Mr. Do Duc Hoang: Co-Founder & CEO, with over 15 years of Forex trading at international banks, shaping strategic direction.
- Ethan Stroud: Content Director, expert in financial publishing with a decade at Click Media (WPP Group).
- Tea H2T: Head of Content, financial analyst delivering timely insights and strategies.
- Ngan Pham H2T: Content Creator, economics-trained marketer simplifying complex knowledge for readers.
- Minh Chau: Content Writer, researcher providing concise, relevant, and actionable financial analyses.
With its commitment to transparency and a trader-first approach, H2T Funding has become a trusted hub for thousands of traders across more than 150 countries. By combining in-depth resources, unbiased insights, and a dedicated team, the platform continues to connect traders with the right capital partners, paving the way for long-term success in professional trading careers.
10. Conclusion
Understanding what trendlines are in trading is more than a technical skill; it’s a way of interpreting the market’s narrative. With this knowledge, you can recognize trend direction, pinpoint smarter entry and exit levels, and trade with greater confidence.
But mastering trendlines is just the starting point. Real progress occurs when you combine these methods with other indicators, price action, and robust risk management to create a comprehensive trading system. That’s where continuous learning makes all the difference.
Explore more in-depth strategies, tutorials, and real trading insights directly on our website, H2T Funding. There, you’ll discover how to integrate trendlines with other techniques to build a data-driven trading system designed for long-term success.
Contact information:
- Website H2T Funding: https://h2tfunding.com/
- Office address: LV 4, 4/567 Group 10 Hoa Lan 1 Residential Area Thuan An, Binh Duong, Việt Nam
- Email us: h2t.funding@gmail.com
- Office hours: Monday-Friday: 9:00 AM – 5:00 PM EST