Have you ever seen a gold chart or a stock market chart? Well, there is no point in staring at such confusing graphs because it takes a specific knowledge of the subject to analyze them. The gold chart and stock market charts have applications in trading, and it is in this field that technical analysis comes to work. Before diving into Support and Resistance indicators, it is mandatory to know about technical analysis.
Technical analysis is a method that trading experts use to analyze or read trading trends such as opportunities, downfall, fluctuations, etc. These readings help traders and investors to profit from the market. To be precise, technical analysis focuses on price movement in the market. It supports industry experts in predicting the near future movements and, hence opportunities.
Now that you have a little idea of technical analysis, support and resistance indicator will not be hard to understand. These two terms hold much value in the market analysis. In the section below, we will discuss what support and resistance indicators are and how to use them.
What Are Support And Resistance Indicators?
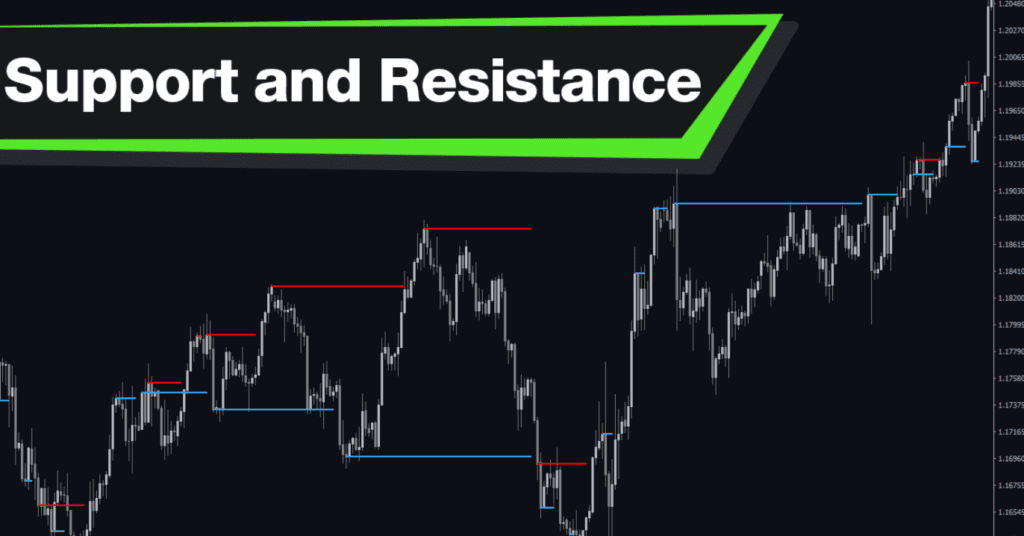
Support and resistance indicators are tools used in trading, particularly in price chart reading. The knowledge of S&R indicators can be derived from Support and Resistance levels. Read below.
Understanding Support
We will learn support and resistance with the help of examples from our daily lives. Do you know about seasonal clothing sales? When winter arrives, summer stock is put on sale (at a lower price) in the ending months, and winter stock goes on sale when summer comes.
Why so? This is because at the end of the season, the demand for the respective category reduces. The same is the case in trading. Supply, demand, and prices move in correlation. When demand is high and supply is low, prices increase, and if supply is higher than demand, then prices fall, just like the winter sales in summer.
Now, at some point, supply and demand would come to equilibrium because lower prices attract buyers. When supply and demand move equally, prices do not fall further, which is called support.
A support point or support zone is a zone beyond which prices do not fall. The support point is the price level at which many buyers are attracted. Say you are satisfied with the cost of a pen that is $10, but you were not when it was $20 earlier. Assume $10 is working for most people, and now the pen will be sold at $10 with no further price drop. This $10 is the support price level. Simply, a support indicator tells when to buy shares.
Understanding Resistance
Now, resistance won’t be a big deal learning. Like the support indicator tells traders when it is an excellent opportunity to buy, resistance works the opposite. A resistance indicator shows the highest price levels. Let us understand with the same example of clothes shopping. During the winter season, winter clothes are in high demand and hence have the highest possible prices.
Not everyone can afford high prices, so they let go of their favorite designs. Isn’t it? When we feel the prices are above the average line or above expectations, we just drop off the idea of buying. We resist buying, and that is what resistance means.
In trading, a resistance level is a price level beyond which prices do not rise any further and start dropping. At the resistance level, traders tend to sell more as the prices are at their peak and can’t go any higher. So they stop and just take up the opportunity. Resistance indicators tell when to sell shares and assets in a market, just like a support indicator tells to buy assets.
Note that S&R are zones/levels, not specific points. They are drawn on the charts to identify possible applications.
Types Of Support And Resistance Indicators
There are generally three types of support and resistance levels-
- Fixed S&R levels. These are levels that are fixed for a long time, and prices never to rarely surpass them. An example of this is the all-time highs and lows of gold. These figures act as a permanent cut-off.
- Dynamic S&R level. From the name itself, it means the levels that shift with price and time. Dynamic levels allow traders to profit from an ever-shifting market. It helps them adapt to trending market scenarios and lock in great deals similar to the past that can happen in the future as well.
- Semi-dynamic S&R level. A bit similar to dynamic level, semi-dynamic levels change but at a fixed rate. These don’t just jump with the market but vary with a fixed rate per candle. Unlike dynamic, semi-S&R levels do not fluctuate rapidly and also do not remain constant like the fixed ones. Fibonacci, Trendlines, and Pivot points are some examples of semi-dynamic S&R levels.
Using S&R Indicators In Trading
Support and resistance indicators have a wide range of applications, and they are only beneficial when used frequently. If they come to work rarely, then there is no point in using them. Let’s see how to use S&R indicators.
One of the most used S&R indicators is the Fibonacci Indicator. A Fibonacci indicator works on a sequence 0,1,1,2,3,5,8,13,21,34,55,89. If you notice the pattern, each figure is the sum of two previous ones, and also, if each figure is divided by its predecessor, an approximate value of 1.61 comes. This value is considered to be the benchmark Fibonacci level, and it helps traders investigate price movement. How high an asset’s price can go or how much loss may come in the way are answerable using this indicator.
Identifying the above, traders set stop loss orders, pending orders, and profit. These indicators can be highly used in risk management. When these are installed, traders can identify highs and lows considering past fluctuations, and make better decisions.
Using these indicators is what helps traders find entry and exit points in the market. It is with indicators that potential selling and buying opportunities are spotted. When a market is in a downtrend, the indicator turns toward the resistance zone, and when it is in an uptrend, the indicators turn toward the Support Zone.
Wrapping Up
Support and resistance indicators are quite beneficial in understanding the trading world. Predictions can be made by considering these indicators. Furthermore, advanced indicators give a clear picture of tumultuous stock market trends. With this, we conclude this article, hoping to have given you valuable insights into the trading world.