The Relative Strength Index (RSI) is a widely used indicator in trading, as it is useful for identifying divergences and potential retracement points in trends.
Volatility is an important factor in crypto markets, creating confusing and unpredictable environments. In that scenario, an indicator like the RSI can help to conduct a more precise analysis.
Understanding the RSI
The RSI is what is known as a momentum oscillator. It helps to measure the magnitude of price changes and its speed variations.
In essence, the RSI identifies overbought and oversold conditions of an asset. It displays a line that oscillates between two values: from 0 to 100.
Typically, values above 75 are perceived as overbought conditions, suggesting a possible price retracement. On the other hand, values below 30 are perceived as oversold conditions, suggesting an upcoming price increase.
How to Use RSI with Other Indicators
Now that we understand the basics of the Relative Strength Index, how to use it to spot signals in the market and integrate it with other indicators?
Let’s see some ways:
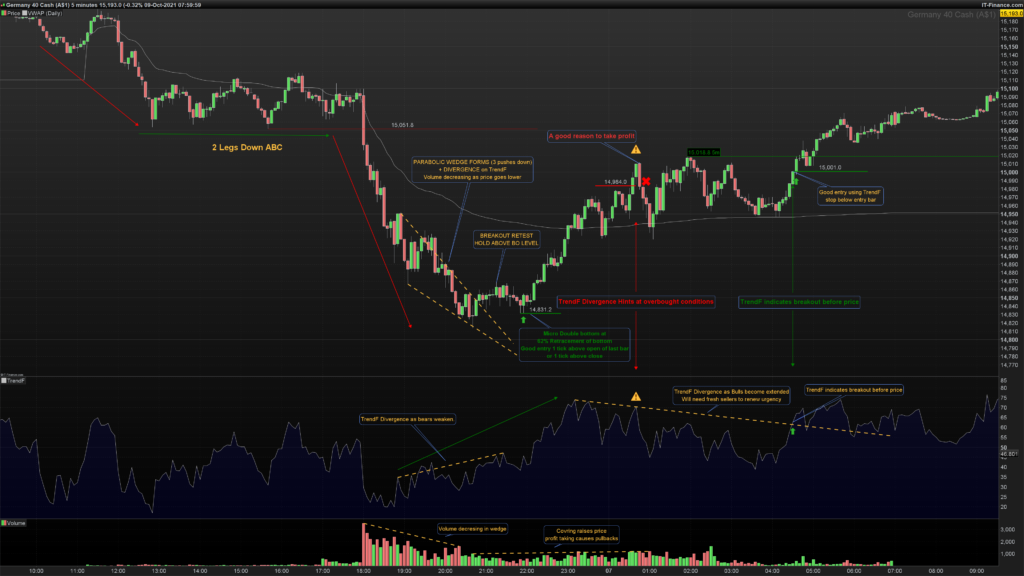
- Identifying divergence: RSI allows one to look for divergence whether on the bullish side or the bearish side. For a bullish divergence, the price has to make a lower low while the RSI makes a higher low. Conversely, for a bearish divergence, the price has to make a high while the RSI makes a lower high.
- Divergence with volume: Previously we saw divergence with price, but this can be used with volume too. This way we add a layer of confirmation. In this case, while the volume is increasing along with RSI divergence, it strengthens the signal; conversely, while the volume is decreasing in the presence of a divergence, it weakens the signal.
Improving the effectiveness of RSI using other indicator
The integration of RSI with other indicators will boost the confirmation of a signal significantly. The RSI can be combined with moving averages or the Stochastic Oscillator.
Using RSI with Moving Averages is very convenient for detecting continuation signals in trends. For example, if the price is downtrending below the moving average, and the RSI crosses above the overbought level during a retracement, it may provide a stronger sell signal for the current direction of the trend.
Using Stochastic RSI is common for confirming overbought and oversold levels. For example, a potential buy signal can arise when the Stochastic RSI crosses the oversold level of 20 in an upward direction.
Considerations and Limitations of RSI
Since RSI is just an indicator it doesn’t predict the future, so it is important not to rely all the trading decision-making on this sole indicator. However, you can consider looking for fundamental analysis to strengthen the effectiveness of RSI signals.
Also, consider outlining a trading plan that integrates RSI, remarking on its advantages and disadvantages, studying risk-reward ratio setups, and testing the strategy in demo accounts before going live. This way you may level up your chances of acquiring high percentages of assertiveness.
Check out also about shorting cryptocurrency.
Conclusion
The RSI is after all an easy-to-understand indicator and a powerful tool to spot signals in a market. This is truer when it is combined with other indicators and with a fundamental lecture on the context of the market.
However, despite its potential effectiveness, it is always important to keep in mind risk management concepts and test the strategy in demo accounts before going live.
Read More From Techbullion And Businesnewswire.com