
The Moving Average Convergence/Divergence (MACD) indicator is a momentum oscillator that is often used for trend-based trading. An indicator that is quite accurate (up to 49%) to predict future price movements.
Also read: how to trade Forex effectively.
The display of this indicator is two lines that oscillate indefinitely. The cross of the two lines provides trading signals similar to that of two moving average systems.
In simple terms, the principles contained in MACD are as follows:
- MACD above zero is bullish, while crossovers below zero are considered bearish.
Then, when MACD rises from below zero it is bullish. When it reverses down from above zero, it means bearish.
- When the MACD line crosses from below to above the signal line, it means that the indicator is considered bullish. The further below the zero line, the stronger the signal.
When the MACD line crosses from above to below the signal line, it means that the indicator is considered bearish. The further above the zero line, the stronger the signal.
During a range of trading activity, the MACD will whipsaw, with a dynamic fast line crossing the signal line. MACD users generally avoid trading in these situations or close positions to reduce the risk of volatility. A stronger signal will be formed through the divergence between MACD and price action at the moment of confirmation of the signal crossover.
MACD can be calculated by subtracting the 26-period Exponential Moving Average (EMA) from the 12-period EMA. The shorter EMA will continue towards and diverge from the longer EMA. This causes the MACD to oscillate around the zero level. The signal line is created with the 9 period EMA on the MACD line.
Trading with MACD Indicator
The MACD indicator works using three components, namely two moving averages and a histogram.
The two lines inside the indicator may look like a simple moving average (SMA). However, it is actually a layered exponential moving average (EMA). The slower main line is the MACD line, while the faster line is the signal line.
If two moving averages come together, it means this is a ‘converging’ situation, and if they are moving away from each other, this situation is called a ‘diverging’ situation. The difference between the two lines is represented by a histogram. If MACD is trading above the zero line, the uptrend is confirmed. Below the zero line, it means the trend is down.
If the market price is in an uptrend, reaches higher highs and higher lows, and breaks key resistance levels, then we may enter a long position.
There are also traders who choose to enter a short position if the asset is in a downtrend characterized by lower highs and lower lows, or a break of a support level.
There are several MACD strategies that can be used to find opportunities in the market. The three most popular strategies are:
-
Crossover
A crossover between two lines provides buy and sell signals. As with most crossover strategies, a buy signal comes when the more reactive short-term line – in this case the MACD line – crosses above the slower line: the signal line. On the other hand, when the MACD line crosses below the signal line, it is a bearish sell signal.
The crossover strategy is based on waiting for a move to occur before opening a position. The main issue MACD faces in a weaker market trend is that when a signal is generated, the price may reach a reversal point. This is then considered a false signal.
It should be noted that strategies that utilize price action to confirm signals are often considered more reliable.
-
Histogram Reversal
The histogram is arguably the most useful component of the MACD. There are bars that represent the difference between MACD and the signal line. When the market price is moving strongly in one direction, the histogram will rise high, and when the histogram is shrinking, the sign is that the market is moving more slowly.
This means, when the bars on the histogram move further than zero, the two moving average lines move further away. Once the initial expansion phase is complete, a hump will likely appear. This is a signal that the moving average is tightening again, which can be an early sign that a crossover is imminent.
When compared to the crossover strategy, many traders consider this strategy superior. Histogram reversals are based on trend knowledge as the basis for placing positions. That is, the strategy can be executed before the market movement actually occurs.
-
Zero Cross
The zero cross strategy is based on one of the EMAs crossing the zero line. If the MACD crosses the zero line from below, a new uptrend may appear, while the MACD crosses from above is a signal that a downtrend may be just starting.
This is often seen as the slowest signal of the three strategies. Usually you will see fewer signals, as well as fewer false reversals. The core of the strategy is to buy or close short positions when the MACD crosses above the zero line, and sell or close long positions when the MACD crosses below the zero line.
This method should be used with caution. Due to its slower character, signals often come out late for fast-moving, choppy markets. However it can be very useful for reversal signals in long sweeping moves.
When using a zero cross strategy, it is very important to understand when to exit the market, or to stop.
Best Time to Use MACD
Actually there is no best time to use the MACD indicator. It is completely up to you, your personal preferences and trading plans. Some people may not have time to use MACD and prefer to use various other indicators to determine price action.
Finex helps every trader who wants to profit both by using technical analysis and fundamental analysis.
If you choose to use MACD, the best time will depend on which strategy you want to use. We have described the three methods above. If you choose crossover, you should pay close attention to your MACD to receive signals as quickly as possible. But if you choose a histogram, you may be able to spend less time monitoring the MACD, because the signals will appear earlier.
The Best Indicators That Can Be Used With MACD
MACD works very well when used with other indicators and with various technical analyses. For example, with support and resistance and candlestick chart patterns, you can identify potential market reversals.
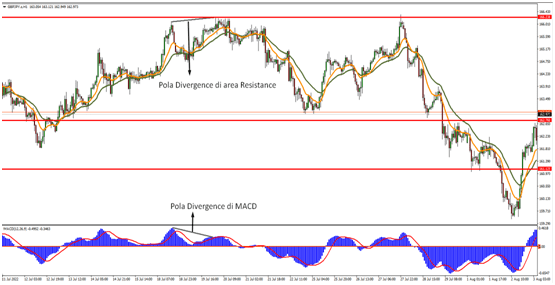
Many traders often use MACD as a divergence indicator to provide an early indication of a trend reversal. For example, when a new high or low occurs, but the MACD histogram fails to reach a new high or low, it is interpreted that the divergence is an indication that the current trend momentum is starting to weaken and the market will soon change direction.
-
Support and Resistance
Support and resistance can sometimes be helpful in identifying when the market reverses direction, and this usually occurs at market turning points. For example, if the MACD gives a divergence from the price indication in an area identified as a major support or resistance level in the market, then that situational fact gives the possibility that the price will change direction soon.
-
Candlestick Chart
Invented by a Japanese rice trader in the 18th century, a candlestick is a type of price chart that displays the high, low, open, and close of a security.
Each bar (or candlestick) represents a trading period, such as a minute, day, week, or month, and is shown as a rectangle (the body), with a small line at the top or bottom (wick).
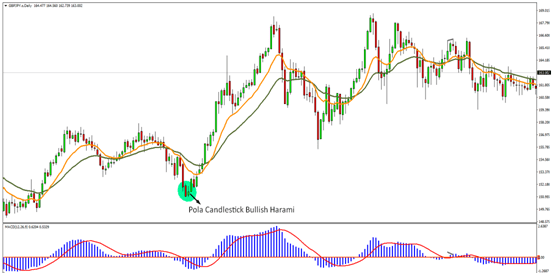
Many strategies or trading signals are generated from candlestick chart, with some patterns on candlestick chart that can tell a trader that a reversal is possible. For example, the evening star pattern, a bearish reversal pattern at the end of an uptrend, and the morning star which is a bullish reversal pattern after a downtrend.
Other candlestick patterns that signal a market reversal are the doji, hanging man, or bullish or bearish engulfing candle. Traders who can recognize one of these candlestick patterns at the same time that the MACD is showing divergence from the market price movement will have several indicators that further strengthen the indication of market movement, whether it is reversing or not.