How to write a good lab report? You have to explain everything you’re doing in detailed prose, craft a comprehensive introduction and abstract for the lab report, and do the calculations spot on.
The last part brings up some problems, as there is so much software out there you can’t decide on what to use. This article helps you with that.
Here are X free and paid solutions you can use.
MATLAB
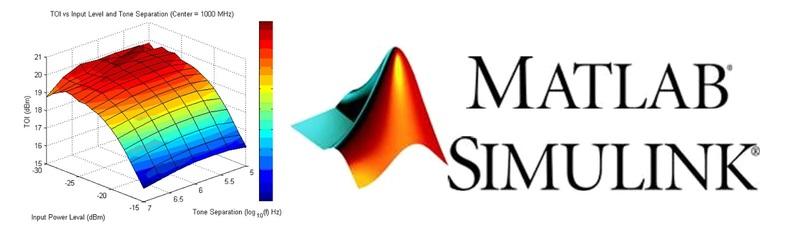
MATLAB is a classic one to use for calculation. Whether you’re doing a chemistry or a physics laboratory report, this tool is going to help you our big time.
Most universities use it, and many tech companies do too. Here’s what this tool packs.
MATLAB is great for robotics engineers and students who are dealing with machine learning. The tool helps you analyze Big Data and connect algorithms to sensors to take your experiment to the next level.
The $55 MATLAB Student suite includes curve fitting, image processing, statistics, machine learning, and symbolic math tools among many others. You can get a version without these toolboxes for just $30. It will give you access to the basic functions, and you can buy add-ons later on.
Many tech universities have an academic license, so you may even use it for free.
The drawback of MATLAB is that it doesn’t have all of the advanced statistical methods, even though it has many.
Statgraphics
Statgraphics is another tool common in academia. A student license would cost you $30, and some universities may have academic licenses. This means your alma mater can let you do the calculations for free.
This tool allows you to use basic statistical methods including ANOVA and perform all sorts of data analysis. You can use categorical and exploratory data analysis, as well as do data mining.
The best thing about it is that you can design experiments in it, and visualize data easily. You can do it in 1D, 2D, and 3D. This helps you bring your research to the next level.
Octave
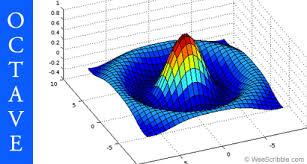
Octave is an open source scientific programming language that many believe to be better than MATLAB. It also survives on the communal effort, and it’s free to use.
It has all the features of MATLAB and is completely compatible with many MATLAB scripts.
Its syntax is somewhat easier than MATLAB. For instance, Octave doesn’t require “…” for line continuation, while MATLAB doesn’t. It also supports different inputs like taking both “~=” and “!=” as NOT.
It has a graphics toolkit, but MATLAB charts look better in comparison. It also doesn’t have some advanced features that are accessible in MATLAB addons.
In a nutshell, if you can’t get a MATLAB license from your university and only need the core functions, go for it. It’s free after all. Even you had to say “write my lab report” to someone or writing it yourself, double checking it with free software is always worth it.
Addi
Need to do calculations on the go? Addi is a great way to go about it.
It’s a MATLAB clone that runs on Android. The app is free and open source. It only weighs 21 MB, so downloading it costs you nothing.
It’s a very basic app, though. You can’t do more than the basic algebraic calculations or implement statistical methods in it. It doesn’t create graphs either.
Mathmatiz
Mathmatiz is an advanced version of Addi. It allows you to do algebraic calculations and visualize them.
The app weighs only 1.1 MB, even less than Addi. You probably can’t integrate the graphs into the lab report, but it’s a great tool for checking the calculations on the go.
Probability Distributions
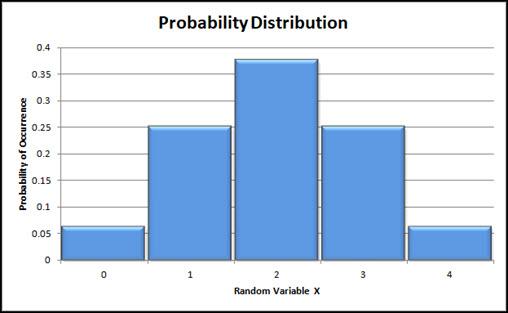
This free Android app helps you do probability distributions on the go. It’s useful if you have to any kind of statistical analysis in your lab report.
You can compute probabilities and plot the probability density for all sorts of distributions including t and chi-square.
Dynamic Math Solver
Dynamic Math Solver is another step up from Addi. It doesn’t have any limitations on the calculations and allows for solving advanced engineering problems.
Unlike Addi, DMS has great visualizations features that allow you to create graphs. You can create documents with these graphs and calculations. This means you can actually use the app for your lab report, not just checking the things as you go.
DMS also has a messenger that allows you to send the results to your friends who have it installed. A real lifesaver for research in teams.
It packs all of this in just over 9 MB too. You get offline documentation as a nice little bonus. Calculate the practical part right in the lab even if you don’t have data on your phone.