Introduction
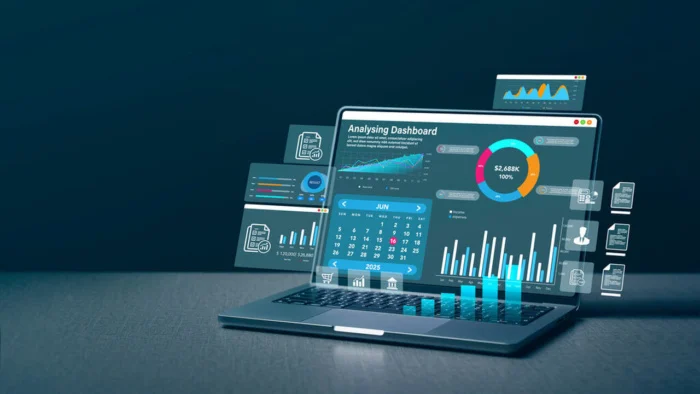
Many companies invest in Tableau dashboards to support better and faster decisions. But building a dashboard is just the first step as its value comes from how well people find it useful. Even accurate data can be overlooked when a dashboard feels slow, confusing or overloaded with information. Good design is not about making a dashboard look visually impressive but about making information easier to find and understand.
A Tableau Research study that analyzed 25,620 Tableau Public dashboards found that familiar chart types were used much more often than complex visualizations. This is a good reminder that simple and familiar visuals can often work better than complicated ones.
A dashboard that is easy to use fits more naturally into people’s daily work. In this blog, we cover Tableau dashboard design best practices that can make your dashboards easier to use and encourage people to come back to them.
10 Tableau Dashboard Design Best Practices That Improve User Adoption
A well-designed Tableau dashboard makes it easier for users to find insights, understand data, and use the dashboard regularly. Let’s look at the 10 best practices below.
1. Define a Clear Business Goal
Every great dashboard starts with one simple question. What does the person opening this actually need to know? Before you add a single chart or settle on a layout it is important to get clear on the purpose first.
A healthcare dashboard might focus on patient admissions, bed availability, appointments, and staff utilization. Adding unrelated metrics, such as marketing numbers, can make the dashboard feel crowded and harder to use. Keeping the dashboard focused on one purpose makes it easier for users to find the information they need without sorting through data that is not relevant to them.
2. Design for Your Users
Not everyone who opens your dashboard needs to see the same information. A fintech manager tracking transaction volume and revenue has very different needs from a risk analyst focused on failed transactions and unusual activity. Trying to build one dashboard for everyone usually makes it harder for anyone to use. Start by thinking about who will use the dashboard and what they need to get from it.
A manager may need an overall view, while a team member may only need data related to their work. Separate views can keep the dashboard focused. You can also use Tableau’s user filters and row-level security which can show users the data relevant to their role without creating a separate dashboard for every team. This makes the dashboard easier to use and more useful in day-to-day work.
3. Create a Strong Visual Hierarchy
One of the most important Tableau Dashboard Design Best Practices is creating a strong visual hierarchy. When someone opens your dashboard they should know immediately where to look first.
Quick tips:
- Place your most important KPIs and charts where they are easy to spot right away.
- Group related information together so that users can follow the dashboard naturally.
- Use larger text for key numbers and leave space between sections.
- Keep the layout consistent so users do not have to search for information every time they open the dashboard.
A simple visual order can make the dashboard much easier to scan and get to the answers they need without unnecessary effort.
4. Choose Charts That Fit the Data
The right chart can make an insight obvious. The wrong one can make even simple data confusing.
Quick tip:
- Bar charts: Compare categories or values.
- Line charts: Works best when you want to show how something changes or trends over time.
- Pie charts: Show parts of a whole but only work well with a few categories.
- Maps: Show data where location matters.
- Scatter plots: Show relationships between two measures.
You can also use Tableau’s Show Me feature to explore chart options which are suitable for your goals based on the fields you select. The right chart always comes down to the type of data and what you need users to understand from it. A pie chart with too many slices becomes hard to read quickly and in those cases a bar chart makes the same differences far easier to compare at a glance. The goal is to choose a chart that makes the data immediately clear so users can focus on what the information is telling them rather than spending time trying to figure out how the chart works.When choosing the right visual approach becomes difficult, Tableau consulting services can help align chart selection with your data and reporting goals.
5. Keep Filters Simple
Filters help users explore the data without making the dashboard harder to use. Keep filters simple and useful. Add filters that help users find what they need, such as date, region, transaction type, or customer segment. If a filter is rarely used, remove it or move it to another view so the dashboard does not feel crowded.
Use clear filter names and set useful defaults. Use single-select when users need one option and multi-select when they need to choose more than one. Dependent filters can also help by showing fewer options based on what the user selects. This way, you can narrow down the data quickly without clicking through a long list of controls.
6. Keep the Dashboard Fast
A dashboard that loads slowly is one that people will eventually stop opening no matter how well it is designed or how valuable the data inside it is. Speed is part of the experience and users notice when it is missing.
Start by removing worksheets that are no longer serving a purpose and also simplify calculations wherever possible. Also, avoid adding more data than the dashboard actually requires and make sure the underlying data source is optimized before you publish. These steps alone can make a noticeable difference in how the dashboard performs day to day. If performance becomes a challenge, you can hire Tableau developers to optimize workbook performance.
Tableau also recommends using efficient data models and reducing the number of queries the dashboard runs according to Tableau’s guidance on designing efficient workbooks. These small improvements can make a noticeable difference when a dashboard is used every day.
7. Give Numbers Some Context
A number on a dashboard does not mean much if you have nothing to compare it with. You might see a figure and still wonder whether it is where it should be or if something has changed. Adding a target or showing the previous period can make that much clearer. For example, if you are looking at this month’s numbers, showing last month’s numbers beside them lets you see the difference straight away. You can also add a target line when users need to know whether they are on track.
In our experience at Bacancy Technology, adding these simple comparisons often makes dashboards easier to understand because users can see what the numbers mean without having to dig through the data themselves.
8. Test the Dashboard With Real Users
When you build a dashboard yourself you already know where everything is and how each chart works. A new user may not know how the dashboard works or what each chart is showing. What feels obvious to you may not be clear to someone using it for the first time.
Ask a few other employees or people who would actually use the dashboard to try it before you publish it. Give them tasks they would normally do and see where they slow down or get stuck. They may struggle to find a filter, misunderstand a chart, or miss what a label means. These are easy things to overlook while building the dashboard but they can make a big difference once people start using it regularly.
Getting that feedback early and fixing issues before launch saves considerably more time than addressing them after the fact.
Conclusion
As we’ve seen, a good Tableau dashboard is not about adding more charts or features. It is about making the right information easy to find and understand. From our work with clients at Bacancy Technology, we have seen that dashboards work better when they have a clear purpose, are easy to use, and avoid unnecessary charts and filters.
Following these tableau dashboard design best practices can help you build dashboards that are easier to navigate, faster to use, and more useful in everyday work. Just give users the information they need without making them work to find it.