In the fast-paced world of cryptocurrency trading, staying ahead of market trends and making informed decisions is crucial for success. One of the most widely used tools for technical analysis is the Relative Strength Index (RSI). This momentum oscillator helps traders evaluate whether a cryptocurrency is overbought or oversold, providing crucial signals for potential buy or sell opportunities. In this article, we will explore what the RSI is, how it works, its application in cryptocurrency trading, and its advantages and limitations. We will also look at how traders can effectively use this tool to improve their trading strategies.
What is the Relative Strength Index (RSI)?
The Relative Strength Index (RSI) is a technical analysis indicator that measures the speed and change of price movements. Developed by J. Welles Wilder in 1978, it helps traders assess the strength of a market trend. The RSI is a momentum oscillator that ranges from 0 to 100 and is commonly used to identify potential reversal points by signaling overbought or oversold conditions.
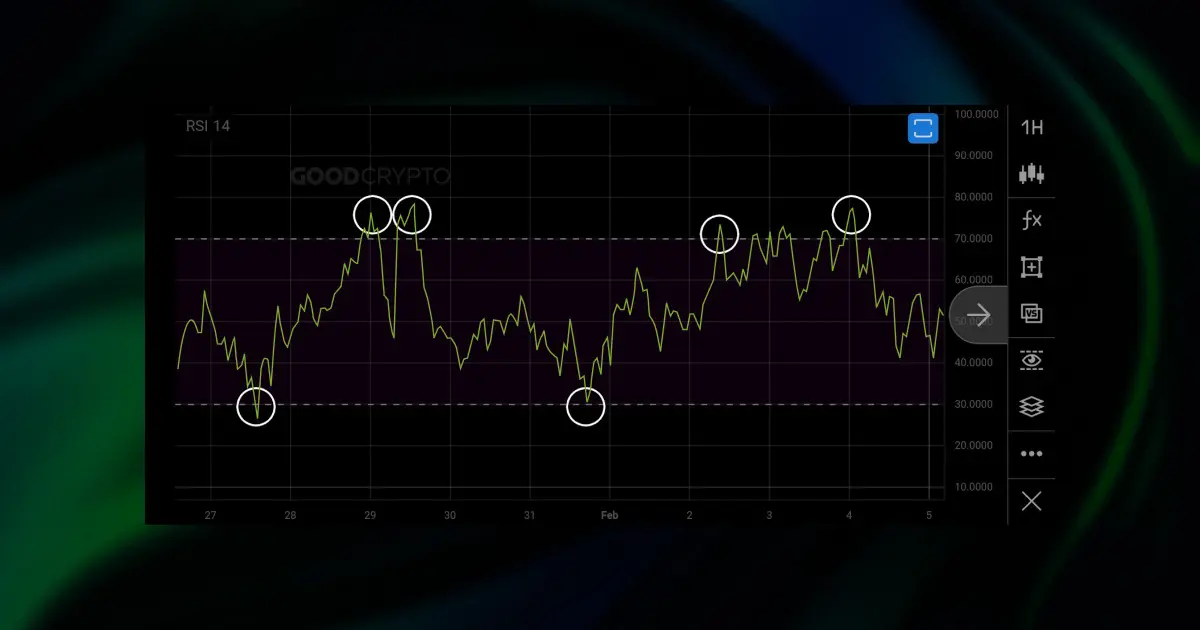
- Range: The RSI value ranges from 0 to 100, with readings above 70 typically indicating that a cryptocurrency is overbought, while readings below 30 suggest that it is oversold.
- Period: The RSI is usually calculated over a 14-day period, though traders may adjust this period based on their trading preferences.
How Does RSI Work in Crypto Trading?
The RSI calculates the magnitude of recent gains and losses to determine the strength of price movements. The formula for calculating the RSI involves the average gain and the average loss over a specific period, typically 14 days. Once the RSI is calculated, traders can interpret its value to help make trading decisions.
- Overbought Conditions: When the RSI value is above 70, it is considered overbought. This suggests that the cryptocurrency may be overvalued and could be due for a price correction or reversal.
- Oversold Conditions: When the RSI falls below 30, it is considered oversold. This implies that the cryptocurrency may be undervalued and could experience a bounce or upward price movement.
- Neutral Zone: An RSI value between 30 and 70 is considered neutral, indicating that the market is neither overbought nor oversold.
Using RSI for Buy and Sell Signals
The RSI provides traders with valuable signals that can help them decide when to buy or sell a cryptocurrency. Here’s how traders can use the RSI in their trading strategies:
Buy Signals
- RSI Crossover: When the RSI crosses above the 30 level, it may signal a potential buy opportunity. This could indicate that the cryptocurrency has reached an oversold condition and is poised for a price increase.
- Bullish Divergence: A bullish divergence occurs when the price of a cryptocurrency makes lower lows, but the RSI forms higher lows. This signals that momentum is building in the direction of the upward trend and could signal a buying opportunity.
Sell Signals
- RSI Crossover: When the RSI crosses below the 70 level, it may signal a potential sell opportunity. This could indicate that the cryptocurrency is overbought and might soon experience a downward correction.
- Bearish Divergence: A bearish divergence occurs when the price of a cryptocurrency makes higher highs, but the RSI forms lower highs. This suggests that the upward momentum is weakening, which could be a signal to sell.
Pros and Cons of Using RSI in Crypto Trading
Pros
- Easy to Use: The RSI is straightforward to calculate and interpret, making it accessible for both beginners and experienced traders.
- Early Reversal Signals: RSI can provide early warnings of potential reversals, giving traders an advantage in entering or exiting positions.
- Versatility: The RSI can be used across various timeframes and markets, making it a versatile tool for crypto traders.
Cons
- False Signals: The RSI can produce false signals, especially in highly volatile markets like cryptocurrencies. This is why it is important to use the RSI in conjunction with other indicators for confirmation.
- Limited by Market Conditions: During strong trends, the RSI may remain in overbought or oversold territory for extended periods, leading to missed opportunities for traders relying solely on the RSI.
- Lagging Indicator: Like many other technical indicators, the RSI is lagging, meaning it reacts to past price movements rather than predicting future trends.
Best Practices for Using RSI in Crypto Trading
To maximize the effectiveness of the RSI in crypto trading, it is important to combine it with other technical analysis tools and follow best practices:
- Use Multiple Timeframes: Check the RSI across different timeframes (e.g., daily, hourly) to get a clearer picture of the trend and reduce the risk of false signals.
- Confirm with Other Indicators: Pair the RSI with other indicators, such as moving averages or the MACD, to confirm buy or sell signals.
- Adjust the RSI Period: Traders can experiment with adjusting the RSI period. While the standard period is 14, shorter periods may offer more sensitivity to price movements, while longer periods may filter out noise.
Conclusion
The Relative Strength Index (RSI) is a powerful tool for crypto traders looking to assess the strength of trends and identify overbought or oversold conditions. While it is not foolproof and has its limitations, using the RSI in conjunction with other technical indicators and risk management strategies can help traders make more informed decisions. By mastering the RSI, traders can better navigate the volatile world of cryptocurrency trading and potentially improve their chances of success.
If you’re interested in improving your trading strategies with advanced tools, consider exploring BitcoinX, a platform designed to enhance crypto trading with AI-driven insights and automated strategies.
FAQ
What is the Relative Strength Index (RSI)?
The RSI is a momentum oscillator that measures the speed and change of price movements, helping traders assess whether a cryptocurrency is overbought or oversold.
How is the RSI calculated?
The RSI is calculated by comparing the average gains and losses over a specific period, typically 14 days. The result is a value between 0 and 100, indicating overbought or oversold conditions.
What does it mean if the RSI is above 70?
An RSI above 70 indicates that the cryptocurrency is overbought and could be due for a price correction or reversal.
What does it mean if the RSI is below 30?
An RSI below 30 indicates that the cryptocurrency is oversold and may be undervalued, suggesting a potential bounce or upward price movement.
Can the RSI be used for all cryptocurrencies?
Yes, the RSI can be applied to any cryptocurrency or asset, as long as there is enough price data to calculate the indicator.
How reliable is the RSI for predicting price movements?
While the RSI is a useful tool for identifying potential reversal points, it should not be used in isolation. Combining the RSI with other technical indicators can improve its reliability.
What is the difference between bullish and bearish divergence?
- Bullish divergence: When the price makes lower lows, but the RSI makes higher lows, indicating potential upward momentum.
- Bearish divergence: When the price makes higher highs, but the RSI makes lower highs, indicating weakening momentum.
How often should I adjust the RSI period?
The standard RSI period is 14 days, but depending on your trading style, you can experiment with shorter or longer periods. Shorter periods offer more sensitivity, while longer periods smooth out the data.