It has recently come to light that Big Data is being used as one of the key resources identified to counter the corona crisis. To make educated decisions on a local and global scale, Big Data technologies provide predictive capabilities and insights from massive amounts of economic, scientific, and epidemiological data.
There is a good reason that this era of Big Data is now impacting many different types of businesses.
What is Big Data?
Big Data refers to data sets that are both large and complex, typically derived from multiple data sources. Big Data runs on such a massive scale that conventional data processing methods can’t keep up.
For starters, there are three categories of Big Data:
● Structured data
The term structured data refers to information that has been recorded consistently. One common form of structured data is an Excel spreadsheet with columns for information such as items, price, date, payment method delivery status, etc. Here, all the information is properly sorted into their respective columns.
● Unstructured data
In contrast to structured data, which has a strict format, unstructured data is free-form. Only a few fields mark significance. Information can be in any format, from text documents to audio recordings to visual images. Only recently, with the help of AI and ML tools, have businesses been able to extract value from previously unstructured data.
● Semi-structured data
Data with some defined fields is called semi-structured. This data, however, is so heavily unstructured that it requires a substantial amount of computational resources to decipher.
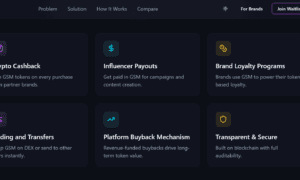
Why You Should Embrace Big Data
It often comes as a surprise to business owners just how much data is produced by their companies. Read on to find out how they can profit from it.
- When a modern company needs to gather information about its customers, it can choose from a plethora of available options. Retailers can analyze data and better comprehend their customers’ intricate shopping habits.
- Modern market intelligence relies heavily on a wide variety of constantly evolving data, which is where Big Data comes in. Product development is another area where Big Data can be useful, similar to how it can aid in competitive analysis.
- Available data tools and technologies can improve R&D, leading to the creation of new products and services.
- Big Data can be used to enhance virtually every facet of commercial activity. It aids in streamlining operations to cut costs, raise output, and enrich client experiences.
- It is possible to improve the efficiency of hiring new employees.
- Organizations can mitigate financial losses and protect themselves from cyber threats through improved fraud detection, risk management, and cybersecurity planning.
How Can You Analyze Data?
There are 3 ways in which businesses analyze their data.
1. Low-fidelity data analysis
Understanding how to use a spreadsheet program like Excel should be sufficient for most small businesses to analyze data to boost and measure the success of their digital marketing and sales efforts.
2. Analyze data with DIY data tools
If you want to see your company succeed, you’ll need to upgrade to more sophisticated methods of data analysis. To integrate your systems, you may need to learn to code or seek the services of a developer.
To aid beginners in data collection, analysis, and comprehension, DIY big data analysis tools prioritize visual representations. This method of analysis is much more accessible and straightforward than using spreadsheets.
3. Having your data analyzed by a professional service
If the thought of learning how to code is daunting, you may want to hire a data analytics consultancy instead. Professional data analysts will help plan, implement, and maintain your data analytics infrastructure. You can benefit from data insights without dealing with the nitty-gritty.
Big Data is Worth A Lot
Data visualization tools allow for the visual representation of data by including features such as streaming data support, AI integration, collaboration, and exploration capabilities. Google Charts, Tableau, Grafana, Chartist, FusionCharts, Datawrapper, Infogram, ChartBlocks, etc., are common data visualization tools. These data tools are adaptable to a wide range of visual preferences, user-friendly, and capable of working with large amounts of data.
Your competitors will eventually use big data insights to their advantage, so you might as well get a head start now.