The XDC Network has recently launched Network Stats, their open-source network analytics platform designed to track and display essential data about the XDC blockchain. Aiming to bring transparency to the XDC ecosystem, this in-house solution provides users with real-time data, including the total number of active nodes and their geolocation, transaction fees, block time, and pertinent performance metrics.
Network Stats allows users worldwide to view and access XDC Network-related data on a comprehensive dashboard that is free to use and compatible with various devices and operating systems.
Enterprise and retail users will both benefit from using Network Stats. The enhanced analytics dashboard will also allow potential applications to visualize the potential of building on or integrating to the XDC Network.
How does Network Stats work?
Network Stats is similar to a web crawling service. Web crawlers navigate relevant search engine pages, discover the recently published web pages, and add these pages to the search engine’s data structure called indexing. Similarly, a blockchain crawler explores the targeted blockchain platform and queries the network’s total nodes to fetch essential insights.
The dedicated crawler for Network Stats crawls the XDC Network via a node discovery protocol to present different metrics made publicly available.
What are the various components of Network Stats?
This quick guide explains the features and functions of Network Stats and how its various components work.
Main Dashboard
When visiting https://stats.xdc.org/ , the Network Stats dashboard appears, providing a glimpse of the XDC blockchain’s network activities. The layout is designed specifically to assist both mobile and desktop users.
The displayed information on the dashboard is updated in real-time, providing you with the latest data and statistics.
Network Activity
Activities are displayed under three main segments – Security, Speed, and Efficiency – representing the XDC Network’s live updates. Also, the ‘Start Guided Tour’ button located on the top right corner guides new users through the dashboard and explains all three segments.
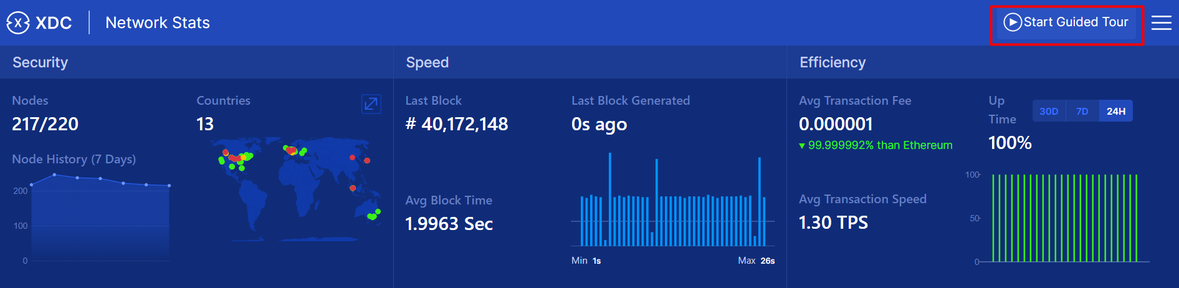
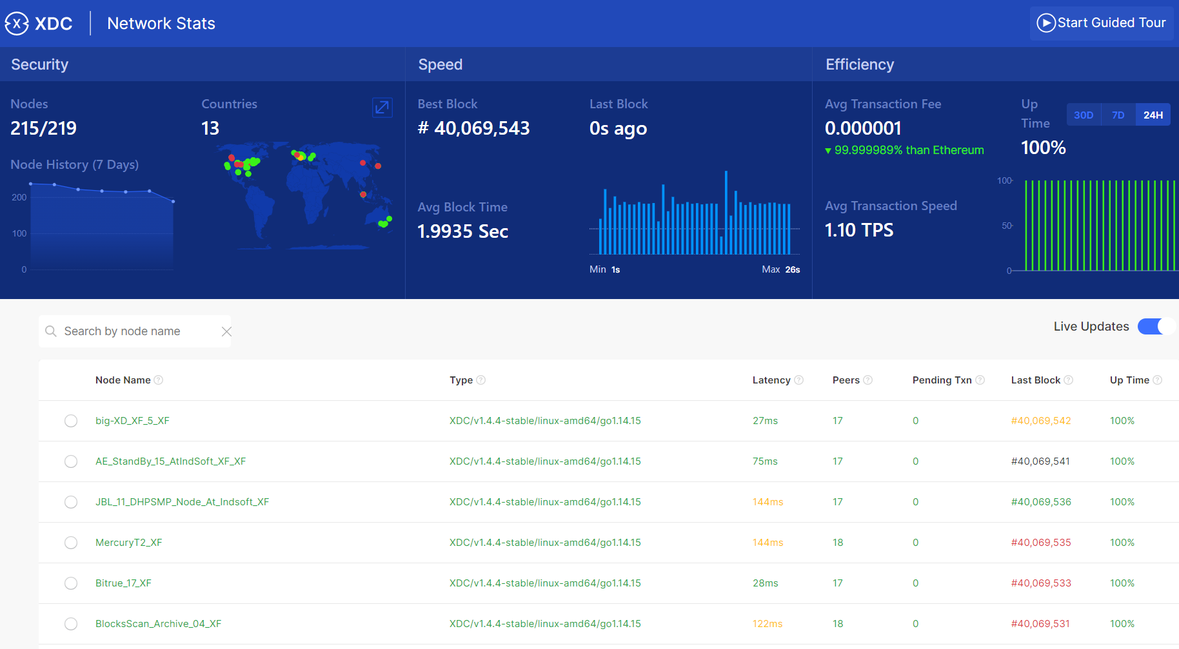
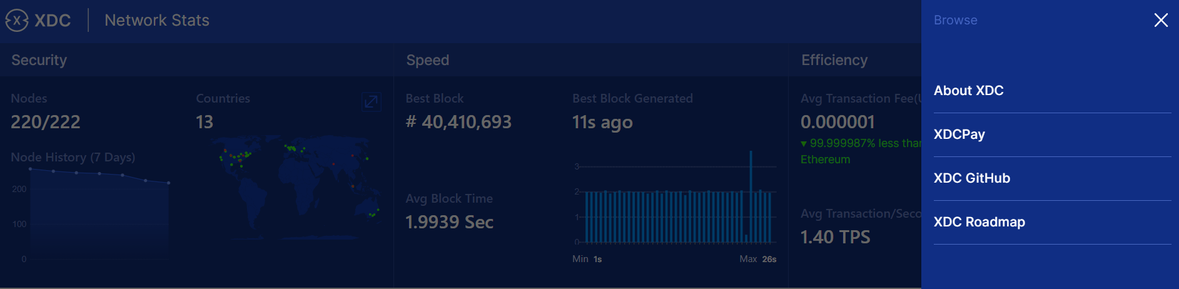
Security
The XDC Network maintains stability and decentralization through various nodes running in different geolocations, showcased on the dashboard. To show that entire nodes are working properly, Network Stats records the node history of the past 7 days, counts the active nodes, and geolocation to present these metrics to the visitors. The Security section provides the following node statistics:

Nodes: Nodes are small servers that store numerous blocks containing data. As shown in the image, there are 218 total nodes on the XDC Network, and 216 are active nodes.
Node History: A line graph displays the increase or decrease in the number of nodes over the past seven days.
Countries: A world map displays the geolocation of the nodes active on-chain.
You can view additional details on the nodes’ geolocations by expanding to a full-screen mode using the icon in the right corner. It will display the number of nodes distributed to the top ten countries and the increase and increase in nodes.
1. Click on the icon.
2. The table opens like this:
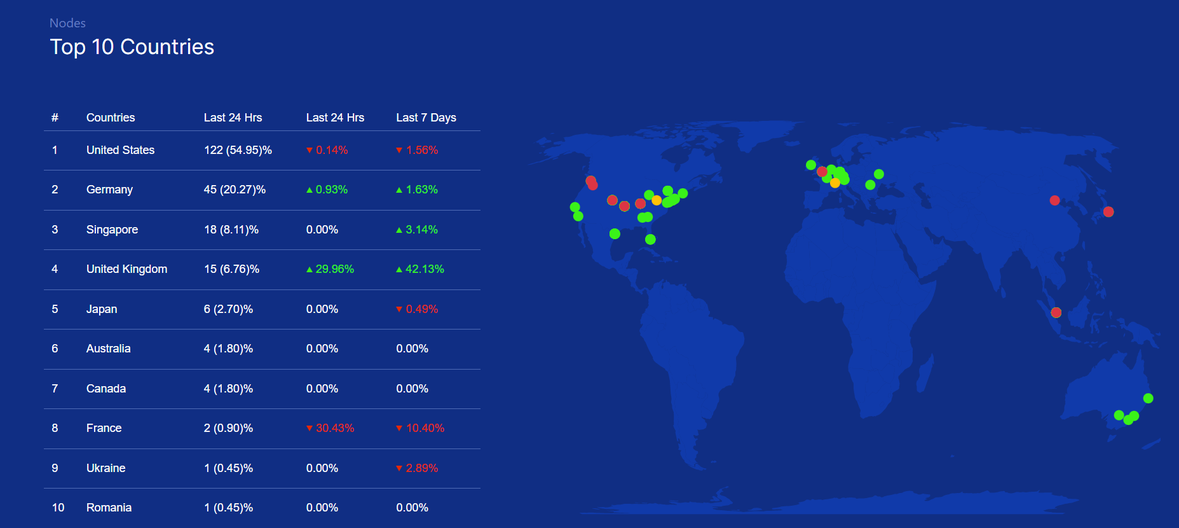
- Green dots represent the active nodes.
- Yellow dots represent nodes that are under moderation.
- Red dots represent the inactive nodes.
Hover over each dot to see the name of the node, as reflected in the following image:

Speed
Speed on the XDC network is defined by factors such as best block, average block time, and the total time required to add a new block. Let’s examine each of these factors.

Best block: Hash of the latest block.
Best block generated: Time when the last block was added.
Average block time: Average time taken to generate blocks.
Graph: A dynamic graph displays the maximum and minimum time required for block creation.
Efficiency
With low transaction fees, fast transaction speed, and zero network downtime, the XDC Network achieves high efficiency and makes the ecosystem more reliable. Let’s examine these factors:

Average transaction fees: The current gas price of the XDC Network and a real-time comparison to Ethereum’s gas fees.
Average transaction speed: Average transaction completed per second.
Up Time: Total network uptime that you can filter according to the last 30 days, 7 days, and 24 hours.
Node Activity Table
Network Stats offers a node activity table that presents the total nodes in sequence. Using this, you can explore thorough details about the nodes and the following details about them:
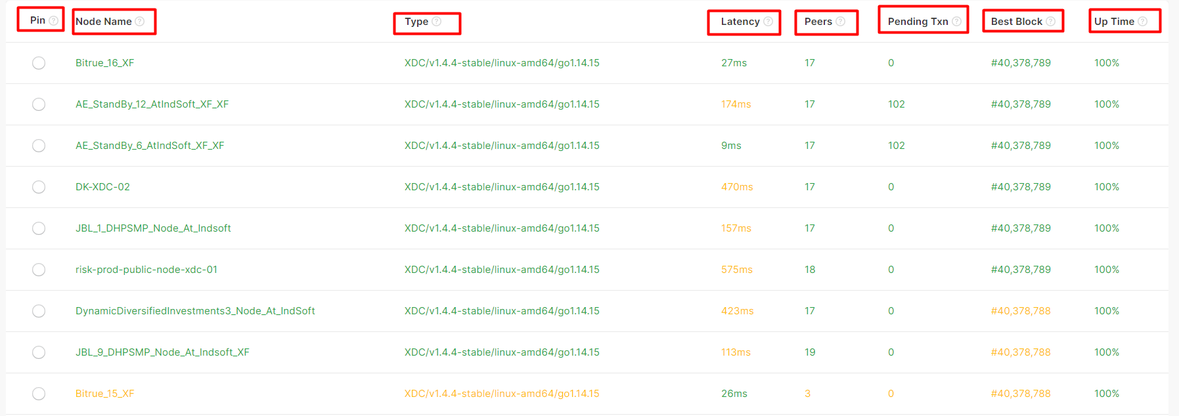
Pin
Pin any node to keep it on the top.
Node Name
Name of the nodes added in the queue.
Type
Details about architecture and version of the node.
Latency
Current day’s delay in acceptance of a transaction.
Peers
Total number of peers sharing the ledger.
Pending Txn
Total pending transactions.
Best Block
Latest block linked to the node.
Up Time
Total uptime in percentage.
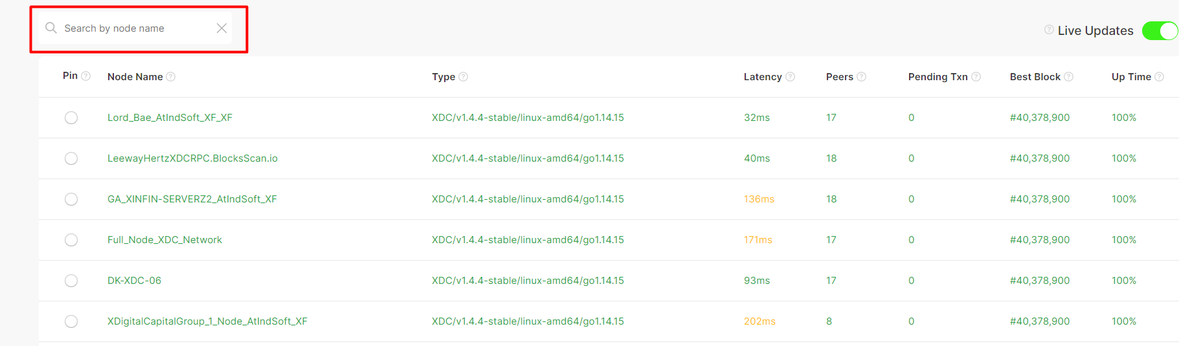
Navigation
Network Stats offers a ‘search bar’ as the main navigation element, and it is located at the top left corner of the network activity table.
Through the search bar, one can search any node by its name and check its associated details, such as the hash of the last added block to that node and total uptime.
There are three bars, also called the burger menu, located in the top right corner of the dashboard. From here, you can access the following details:
About XDC – Redirects you to the XDC Foundation’s latest publications on Medium.
XDC Pay: Opens the Chrome web store and allows you to navigate and add the latest version of XDCPay Browser Extension to your browser.
XDC GitHub: Redirects you to the official GitHub account of XDC foundation, where you can see various repositories.
XDC Roadmap: Links to a page that displays upgrades and upcoming release information.
To access the Network Stats, click here.
Conclusion
What should you do with Network Stats?
Utilize the data!
In the interest of providing a holistic network explorer solution to the blockchain industry, Network Stats emerges to serve blockchain developers worldwide by providing valuable insights into the XDC ecosystem. Users can evaluate the network’s performance before building an application on top of the XDC Network.
In addition, this tool allows node developers, security developers, media reporters, and technology researchers to analyze the network using the data provided and suggest further ways to enhance the existing XDC ecosystem. The XDC community also welcomes discussions on GitHub. Since it is open-source, developers can fork the code and build alternative decentralized solutions.