
Measure Slippage Against a Defined Quote, Not a Convenient Chart Price

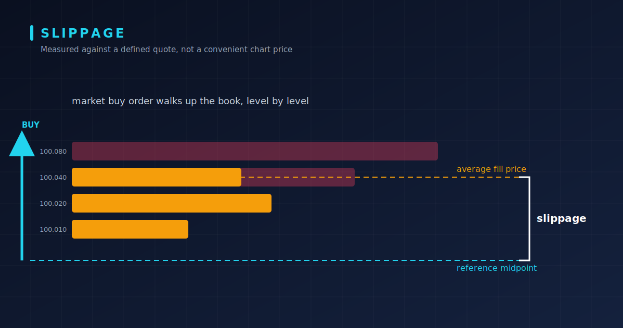
What is slippage in crypto? It is the gap between the price you expected and the price you actually got. That sounds simple, but the number you report depends entirely on what you call “expected”. Compare a fill with a candle close and you get one answer. Compare it with the best ask a moment earlier, and you get another. If you have ever asked what slippage means in crypto and received three different numbers, this is why.
This article shows how to measure slippage that crypto traders can actually reproduce, using a hypothetical order book. All prices are invented for illustration and are not trade signals.
Fix the Reference Quote and Observation Timestamp
Pick one reference price and one timestamp before looking at the fill. Here, the reference is the midpoint of the best bid and best ask on a single exchange, observed at 12:00:00.000 UTC on BTC/USDT.
The best bid is 100,000, and the best ask is 100,010, so the reference midpoint is 100,005. The ask side of the book looks like this:
| Ask price | Size available (BTC) |
| 100,010 | 0.5 |
| 100,020 | 1.0 |
| 100,040 | 2.0 |
| 100,080 | 3.0 |
Now imagine the one-minute candle for that period closed at 99,990. If you measured a buy fill against that candle close, you would report a larger “slippage” than against the midpoint, even though the order and the fill are identical. A candle close is a past trade, often on the other side of the spread. It is not a price you could have bought at. Pick a reference you could actually have traded against, write it down, and keep it fixed. If you need a refresher on bids, asks, and depth, see how to read a crypto order book.
Separate Spread, Latency, Market Impact, and Fees
Slippage is not one thing. Take a hypothetical market buy of 3 BTC sent at 12:00:00.000. The order reaches the exchange slightly later, and by then every ask level has moved up by 3.00.
The order fills across three levels: 0.5 BTC at 100,010, 1.0 BTC at 100,020, and 1.5 BTC at 100,040, each plus the 3.00 drift. The average fill is 100,031.33 per BTC. Against the 100,005 midpoint, that is 26.33 per BTC of slippage, which breaks down like this:
- Half-spread: 5.00. The best ask sits 5.00 above the midpoint, so even a one-lot order pays this.
- Latency drift: 3.00. The market moved between decision and arrival.
- Market impact: 18.33. The order consumed deeper levels, and the average price rose from the best ask of 100,010 to 100,028.33.
On 3 BTC, that is 79.00 USDC of total slippage (26.33 times 3, rounded). Fees are a separate line. At a hypothetical taker fee of 0.05%, the fee on this fill is about 150.05 USDC. Fees are a real cost, but they are not slippage, and mixing the two makes both numbers harder to interpret. For a fuller treatment of how quotes, fills, and strategy costs relate, read this guide on what is slippage in crypto.
Report a Distribution Across Comparable Hypothetical Order Sizes
A single fill tells you very little. Repeat the same measurement for several order sizes, with the same reference rule and the same 3.00 latency drift.
| Order size | Average fill | Slippage per BTC | Slippage (bps) | Total slippage (USDC) |
| 0.4 BTC | 100,013.00 | 8.00 | 0.80 | 3.20 |
| 3 BTC | 100,031.33 | 26.33 | 2.63 | 79.00 |
| 6 BTC | 100,053.83 | 48.83 | 4.88 | 293.00 |
An order 15 times larger does not cost 15 times more in total. It costs about 90 times more, because larger orders walk further into the book. That is why a small test order tends to understate the cost of a larger one.
Then repeat across time. Suppose the 3 BTC order is measured at five different timestamps and produces 1.9, 2.3, 2.6, 3.4, and 5.1 bps. Report the median (2.6 bps) and the range (1.9 to 5.1 bps), not one lucky observation. State the exchange, pair, dates, reference rule, and fee assumptions beside the table so someone else can reproduce it.
Frequently Asked Questions
Is slippage tolerance the same as expected slippage? No. Slippage tolerance, such as the setting on a decentralized exchange, is a limit on how much worse a fill can be before the trade is rejected. Expected slippage is your estimate of what the fill will actually cost. A tolerance of 1% does not mean you should expect to lose 1%.
Can a candle close prove an executable price? No. A candle close is the last trade in that interval. It does not show whether your full order size was available at that price, or on which side of the spread the trade occurred.
Why can a tiny order understate larger-order execution costs? A tiny order fills at the best price and pays only the spread. Larger orders consume more levels, so their average price moves further from the reference, as the 0.4 BTC and 6 BTC rows above show.
Conclusion
Slippage only becomes a useful number once the reference quote, timestamp, and order size are fixed. Separate spread, latency, and market impact from fees, then report a range across order sizes and observation times. Measured that way, slippage tells you what a trade is likely to cost, not just what it happened to cost once.






Comment