Inventory management is a critical aspect of business operations, particularly for organizations selling across multiple marketplaces. It has been one of the key focus areas in my career as a Software Development Engineer, during which I have designed and implemented advanced supply chain solutions that optimize inventory tracking and reduce losses.
Most companies rely on traditional tracking systems and periodic audits to manage discrepancies—but these outdated methods only catch problems after they’ve already caused financial damage. The longer it takes to detect an issue, the harder it is to recover lost stock, leading to unnecessary write-offs, operational inefficiencies, and a direct hit to profitability.
Advancements in graph analytics and supply chain intelligence tools offer powerful solutions that revolutionize inventory tracking, loss detection, and reconciliation. Graph analytics can fundamentally transform inventory control, providing businesses with a powerful tool to track inventory movements dynamically, prevent financial losses, and optimize reconciliation processes.
This article will delve into the importance of tracking inventory movements, explore how graph databases enhance visibility, and demonstrate how businesses can reconcile lost inventory efficiently.
The Growing Complexity of Inventory Management
Global supply chains are inherently complex. Companies selling products across multiple marketplaces must account for inventory movement across different regions, warehouses, and retail partners. This complexity introduces numerous points of failure. Several key challenges hinder effective inventory tracking and reconciliation.
- Fragmented Systems: Many organizations operate multiple inventory management solutions that are not fully integrated, resulting in visibility gaps.
- Delayed Loss Detection: Losses from theft or mismanagement often go unnoticed for weeks due to batch reconciliation processes.
- Lack of Real-Time Visibility: Without analytics, businesses can’t proactively address discrepancies, leading to financial losses.
- Supply Chain Bottlenecks: Poor inventory tracking results in misplaced stock and delays, affecting fulfillment times.
One key takeaway is that static inventory tracking methods fail in dynamic supply chains. Organizations need adaptive, intelligent systems capable of understanding inventory relationships and identifying discrepancies instantly. This is where graph databases outperform traditional relational systems.
Leveraging Graph Databases for Inventory Tracking
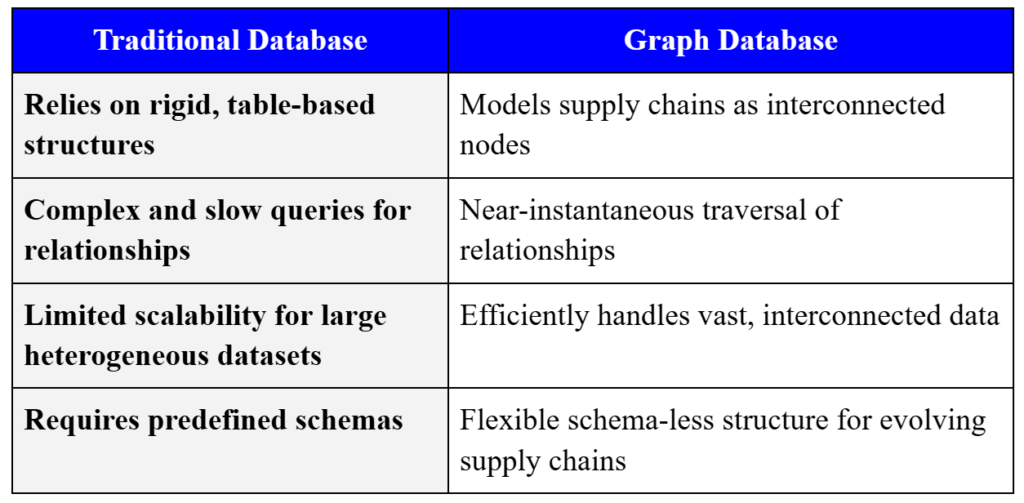
Unlike traditional databases with rigid tables and complex queries, graph databases organize inventory as a network of interconnected products, suppliers, and warehouses. This enables real-time tracking, faster anomaly detection, optimized replenishment, and loss prevention by seamlessly navigating relationships between inventory nodes.
How Graph Analytics Improves Inventory Management
BT Group, for instance, implemented Neo4j, an advanced tracking system that reduced capacity planning time by 50% and decreased human decision points by 60%. While their case focused on network infrastructure, the principles apply directly to inventory tracking across retail, warehousing, and global distribution networks. By leveraging real-time visibility into their inventory movements, they were able to prevent stock misallocations, reduce operational bottlenecks, and reconcile discrepancies far more efficiently.
“The Neo4j SRIMS platform provides significant performance improvements over the previous relational database solution, enabling radical new levels of efficiency and insight.”
— Sreenath Gopalakrishna, Director of Software Engineering, BT Group
Based on my experience, businesses facing challenges similar to those of BT Group must focus on the following key areas to enhance inventory tracking and reconciliation:
1) Shift to Real-Time Monitoring: Instead of periodic audits that reveal losses late, implement a real-time inventory system using data analytics and machine learning to catch stock issues immediately.
2) Use Relationship-Based Tracking: Move from isolated inventory tables to a model linking each item to its movement history, suppliers, and locations to pinpoint loss more effectively.
3) Automate Reconciliation: Minimize financial losses through automated reconciliation systems that match lost records with found stock in real-time, eliminating delays and write-offs.
4) Identify High-Risk Loss Points: Analyze past losses to assign risk scores to locations and products, allowing proactive measures in theft, misplacement, or errors by enhancing security and oversight.

Detecting Losses and Anomalies Using Graph Analytics
Identifying loss points in inventory movements is crucial for preventing revenue leakage. Traditional methods involve reconciliation audits, which are time-consuming and reactive rather than proactive. Graph-based systems, on the other hand, use anomaly detection algorithms to proactively flag discrepancies.
Key Benefits of Graph-Based Loss Detection
- Fraud Detection: By analyzing the relationships and patterns within supply chain data, graph databases can identify suspicious activities, such as unauthorized diversions or unusual transaction patterns, enabling timely intervention.
- Damage Identification: Graph analytics facilitate the pinpointing of specific nodes or links within the supply chain where goods are frequently damaged, allowing companies to implement targeted process improvements.
- Pattern Recognition: Leveraging AI-driven analytics, graph databases detect outliers and irregularities in inventory flows, helping to identify potential theft, misplacements, or systemic inefficiencies.
For instance, AWS Supply Chain sets up a data lake using machine learning models to understand, extract, and transform disparate, incompatible data into a unified data model. This data lake can ingest information from various sources, including existing ERP systems like SAP S/4HANA and other supply chain management systems. By unifying data in this manner, businesses can gain real-time visibility into their supply chain operations, enabling proactive anomaly detection and loss prevention.
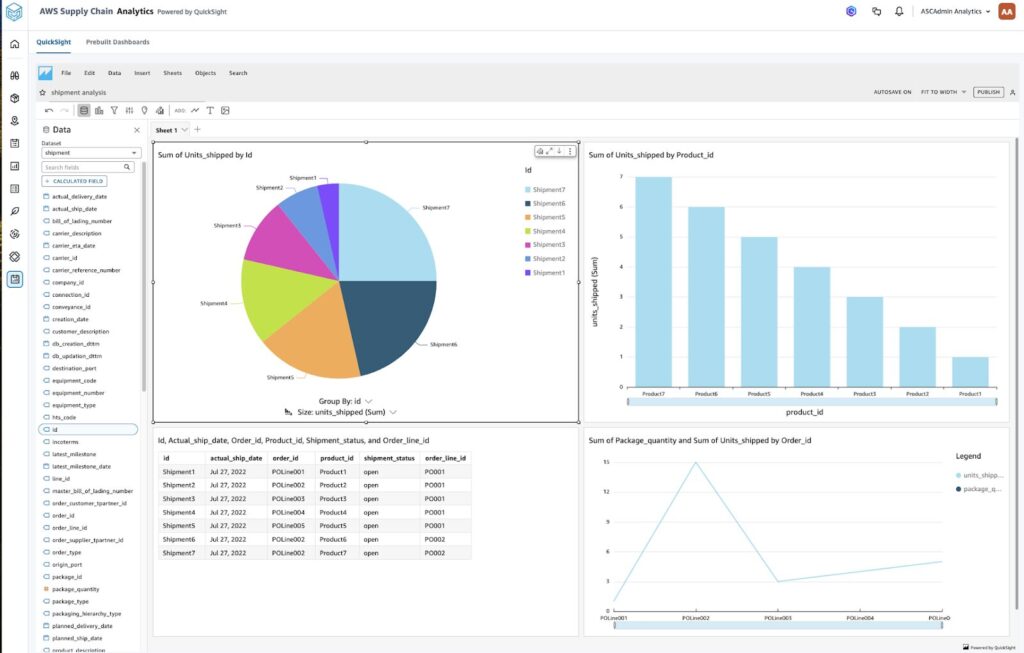
Image: AWS Supply Chain Analytics
If shipment discrepancies are detected—for example, an unusual drop in units shipped for a specific product—anomaly detection tools integrated into AWS Supply Chain Analytics can immediately flag the issue. Businesses can use tabular data and shipment patterns to identify root causes, such as operational bottlenecks or data entry errors.
Using a unified analytics platform, businesses can trace shipment paths with graph traversal methods to pinpoint the origins of discrepancies and automate reconciliation by comparing expected shipment volumes against actual outcomes. This process enables the matching of missing inventory with discovered or recovered stock, effectively reducing financial write-offs and ensuring accurate stock records.
Improving Inventory Reconciliation with Graph Databases
Effective reconciliation is critical for inventory accuracy and financial reporting. Graph-based systems provide a framework for reconciling inventory through advanced data visualization and traversal capabilities. These tools enable organizations to match unaccounted inventory with recorded losses, reducing financial write-offs and improving stock management processes.
Steps in Graph-Based Inventory Reconciliation
1) Identify Discrepancies: Using graph-based analytics, businesses can compare expected versus actual inventory levels at every checkpoint in the supply chain. This helps pinpoint discrepancies early in the process.
2) Trace Inventory Movements: Graph traversal algorithms allow for detailed tracking of inventory movement histories, providing clarity on where losses or errors originated.
3) Match and Update Records: Misplaced stock can be automatically matched with previous loss records, ensuring that reconciliation processes are both accurate and efficient.
4) Optimize Reallocation with Machine Learning: By integrating machine learning, graph systems can suggest optimal reallocation strategies for reconciled inventory, ensuring it is redeployed effectively within the supply chain.
A recent implementation using Amazon Neptune showcases its ability to streamline inventory reconciliation. Using Neptune’s graph traversal capabilities, businesses have been able to trace shipment anomalies and resolve discrepancies in real time. By identifying discrepancies between expected and actual shipment volumes, organizations can accurately track the last-known locations of missing stock and align them with previously recorded losses.
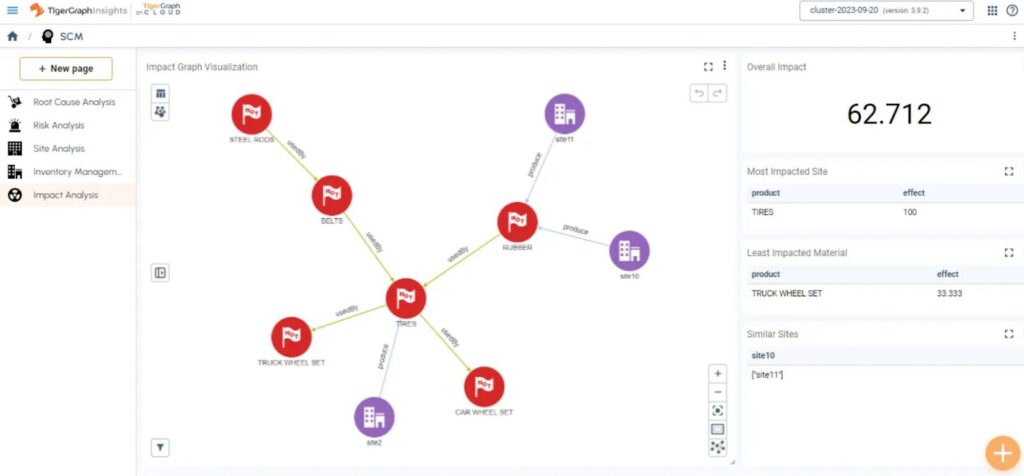
In addition to reconciliation, graph-based systems also offer detailed impact analysis for supply chain disruptions. This is particularly valuable when a production site or critical supply chain node experiences reduced capacity or operational issues. TigerGraph, for instance, can map complex dependencies and relationships between inventory, production sites, and downstream products, making it a powerful tool for assessing and mitigating risks.
For example, a case study showed that the production capacity of a major rubber supplier decreased by 50%. TigerGraph’s analysis revealed that this reduction significantly impacted downstream products, such as tires and car wheels. The system calculated the unmet demand and recommended redistributing production to alternate sites, minimizing the overall disruption. This analysis enabled the company to make informed decisions, reduce losses, and maintain operational stability.
Integrating automated reconciliation processes allows businesses to recover lost inventory while also boosting overall visibility and resilience in their supply chains. This shift minimizes revenue losses, improves financial reporting accuracy, and strengthens supply chain operations.
Transforming Inventory Management with Graph Analytics
Inventory management is shifting away from static stock counts and scheduled audits. Real-time intelligence, predictive insights, and scalable analytics are now essential. Graph databases are leading this change by helping businesses gain instant visibility, detect and prevent losses, and reconcile discrepancies efficiently.
Integrating these technologies with AI-powered analytics allows businesses to manage global supply chains more effectively. Gartner predicts that by 2028, generative AI will drive 25% of key performance indicator (KPI) reporting, helping supply chain professionals make better decisions. AI-powered warehouse operations are also expected to replace traditional scanning methods, improving speed and accuracy while reducing safety risks.
For innovative companies, utilizing graph-based inventory management solutions is essential for sustaining a competitive advantage. By harnessing data-driven insights, businesses can evolve their supply chains into efficient, loss-resistant systems that enhance operations, minimize financial losses, and bolster resilience for the future.
About the Author:
Anand Kumar is a Software Development Engineer at Amazon with extensive expertise in leveraging graph databases to enhance business operations. Over the past decade, he has built enterprise solutions that integrate graph-based analytics and machine learning to improve the operational efficiency of businesses. His current work focuses on using graph database technologies to model complex supply chain relationships, helping global organizations optimize inventory placement, reduce costs, and streamline decision-making processes.
References:
1) CXO Team. (2023, July 4). Director of Technology at British Telecom reveals Game-Changing insights on future of telecom and Graph database technology. Cxotv. https://cxotv.techplusmedia.com/technology/director-of-technology-at-british-telecom-reveals-game-changing-insights-on-future-of-telecom-and-graph-database-technology/
2) Optimize supply chains — AWS supply chain features — Amazon Web Services. (n.d.). Amazon Web Services, Inc. https://aws.amazon.com/aws-supply-chain/features/#Supply_chain_data_lake_
3) Thakur, D., & Chaudhuri, R. (2023, May 10). Supply chain data analysis and visualization using Amazon Neptune and the Neptune workbench | Amazon Web Services. Amazon Web Services. https://aws.amazon.com/blogs/database/supply-chain-data-analysis-and-visualization-using-amazon-neptune-and-the-neptune-workbench/
4) Sayed, N. (2024, February 28). Mastering Inventory Management with Graph Analytics. Medium. https://medium.com/@saynawaf6399/how-graph-database-improve-supply-chain-management-8b2523ce7859
5) TigerGraph. (2020). Improving supply chain visibility with advanced analytics on graph [White paper]. TigerGraph.
https://cdn2.hubspot.net/hubfs/4114546/TigerGraph_Supply_Chain_White_Paper.pdf
6) McMillan, A. (2024, May 31). Gartner: How AI is Revoluting Supply Chain Management. Procurement Magazine. https://procurementmag.com/technology-and-ai/gartner-how-ai-is-revoluting-supply-chain-management