
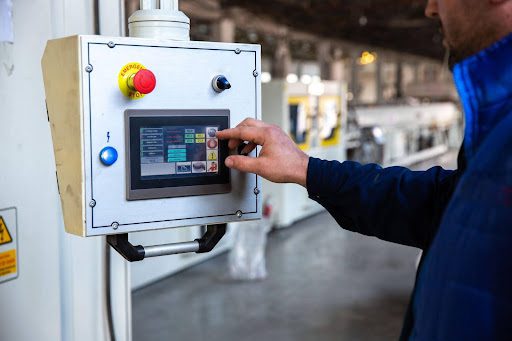
Temperature controllers sit on walls and control rooms across factories, labs, and food facilities. Their screens show numbers, abbreviations, and blinking symbols that can look cryptic if you do not work in automation every day. Yet those parameters influence product quality, energy use, and alarm behavior shift after shift.
When you open the front panel of most modern temperature control systems, you will see far more than a single temperature value. Setpoints, process values, outputs, alarm limits, and tuning constants interact behind the scenes. Once these terms are clear, the display turns from confusing jargon into a concise summary of how your process behaves.
Why Controller Parameters Matter
Each parameter tells part of the story of how heat moves through your process and how aggressively the controller responds. A freezer that oscillates between too cold and too warm, an oven that overshoots targets, or a chiller that runs constantly all leave clues in the parameters. Reading them correctly allows non-engineers to ask better questions and to spot emerging problems early.
Core Values on the Display
Most controllers present two or three prominent readings: the temperature you want, the temperature you have, and the effort the system is making to close the gap.
Setpoint (SP) and Process Value (PV)
The setpoint is the target temperature, chosen for product or process requirements. The process value is the actual measured temperature at the sensor. The difference between the two is often called the error, although that term may not appear on the display.
If the PV consistently sits a little above or below the SP, the system may be stable but biased. In that case, you see a steady offset. If PV swings widely around SP, the system is poorly tuned, oversized, or affected by strong disturbances such as repeated door openings or variable product load.
Output or Control Signal
The output shows how hard the controller is working to correct the difference between SP and PV. It is usually expressed as a percentage from 0 to 100 and drives heaters, valves, or compressors. High output near 100 percent means the system is pushing at full capacity; very low output suggests minimal effort.
This value is useful because it indicates whether a temperature deviation comes from a lack of capacity or from tuning and configuration. If PV is wrong and output is already close to 100 percent, the plant may be undersized or subject to unusual load. If PV is wrong while output remains modest, the issue may lie in tuning, sensor placement, or configuration rather than hardware limits.
Key front-panel values to watch include:
- SP (setpoint): The required process temperature, agreed with process or quality teams.
- PV (process value): The actual sensor reading, reflecting real conditions at the probe location.
- Output percentage: The controller’s effort level, which hints at capacity margins and disturbances.
- Alarm indicators: Symbols or lights that show when limits, sensor faults, or hardware errors occur.
Tuning and Stability Parameters
Behind the main display, controllers hold parameters that govern how they respond over time. These tuning values have a strong influence on stability and overshoot.
Proportional, Integral, and Derivative (PID)
Modern controllers typically use a PID algorithm. The proportional term sets how strongly the controller reacts to the current error; integral addresses accumulated error over time; derivative anticipates changes by looking at the rate of temperature movement.
If proportional action is too aggressive, the system may overshoot and oscillate. If integral action is too strong, it can cause slow swings as the controller “winds up” during disturbances. Derivative can help dampen motion but may amplify sensor noise if misapplied.
Hysteresis, Deadband, and Ramp
On simpler on–off controllers, hysteresis or deadband defines how far PV must move before the output changes state again. A narrow band gives tight control but can cause frequent switching; a wider band reduces wear on equipment at the cost of larger temperature swings.
Some controllers offer ramp functions, which allow the setpoint to change gradually over time. This protects sensitive product or equipment from thermal shock and reduces overshoot during large setpoint steps. When ramp parameters are visible, they signal that the process has been designed with controlled transitions rather than abrupt jumps.
Alarms, Limits, and Data for Real Operation
Beyond control behavior, parameters also define how the system alerts humans and how it records performance. These settings connect technical behavior to day-to-day decision-making on the floor.
High and low alarm limits specify when the controller should warn staff that PV has strayed beyond acceptable bounds. Delay times can be configured so that brief, harmless disturbances do not flood operators with alarms. In multi-zone systems, each chamber or loop may carry its own alarm thresholds tailored to the products stored there.
Data-logging options capture SP, PV, alarms, and sometimes output over time. When parameters for logging interval, storage length, or communication are visible, they indicate how much historical data will be available for audits or troubleshooting. Having a basic awareness of these options makes it easier to request trend reports that align with the quality questions or management inquiries that need to be addressed.
Turning Parameters into Practical Insight
Facility staff do not need to be control engineers to benefit from these readings. A basic habit of checking SP, PV, output, and alarm limits helps reveal whether problems come from doors, load, tuning, or capacity. In practice, controller parameters act as a compact language that links process behavior, equipment health, and product quality in a way that is easy to learn to read.