How to Analyze MySQL Data Using dbForge Studio’s Pivot Table Feature
Data analysts, data engineers, and data scientists often write SQL queries to interpret the data they work with. This can involve writing complex queries with multiple joins, table functions, case statements, and transposing rows to columns. The result of any query is a dataset tailored to specific needs. Changes to input conditions or test scenarios may require creating a new query or refining the existing one. And, once developed, run, and tested, a query can serve as the foundation for stored procedures, views, or data visualizations.
Ideally, data analysis should offer quick and simple methods to filter, aggregate, summarize, and manipulate data for what-if analysis. It should also clearly highlight trends and anomalies, effectively telling the story behind the data. The easier it is to perform these kinds of tasks, the quicker businesses can make informed decisions. However, sometimes, this process can be quite challenging without proper tools to handle this kind of work.
dbForge Studio for MySQL is a graphical IDE for database development, administration, architecture, query writing, reporting, and data analysis. Compatible with MySQL and its forks, including MariaDB, Amazon Aurora MySQL, and Percona, it excels at delivering valuable insights, making data more readable and easier to interpret.
In this article, we’ll explore how to use the Pivot Table feature in dbForge Studio for MySQL to level up data analysis and visualization.
What Is a Pivot Table?
Before we start exploring the Pivot Table feature, let’s briefly learn about pivot tables, in general, to ensure we understand how they can assist us in our daily data analysis tasks.
A pivot table organizes data from multiple detailed tables by grouping individual discreet values and aggregating sums, averages, counts, and other statistics. Pivot tables provide a clear representation of trends and tendencies, increasing data readability and enabling swift analysis by highlighting key insights without any changes in the database itself.
Pivot tables often consist of four components that let viewers easily navigate between the key insights highlighted in a certain structure. Let’s overview them in detail.
Columns. These fields are often used to measure and compare data. By adding column labels and field values to your report, you can highlight only the most valuable information.
Rows. These are the fields used for data you want to analyze within a pivot table.
Values. This type of field is used in a pivot table for comparison and often displays the summarized information. Its most common values are sum, average, minimum, and maximum.
Filters. Used for table data sorting, calculations and restrictions, filter fields can be optional. Still, it’s also possible to include them in pivot tables.
In this article, we’ll refer to these components often in our guide to using the Pivot Table feature in dbForge for MySQL data analysis.
Overview of the Sample Database for MySQL Analysis
To better understand how pivot tables work, let’s explore the database we’re going to use for demonstrational purposes. Our test case involves a MySQL sample database called “classicmodels.” This database represents the order processing system of a toy replica store with multiple offices, selling various replicas of cars, airplanes, ships, trains, motorcycles, and more. Each category has different products. The orders and order detail tables include the order date and the quantity ordered for each product.
The data model is shown below:
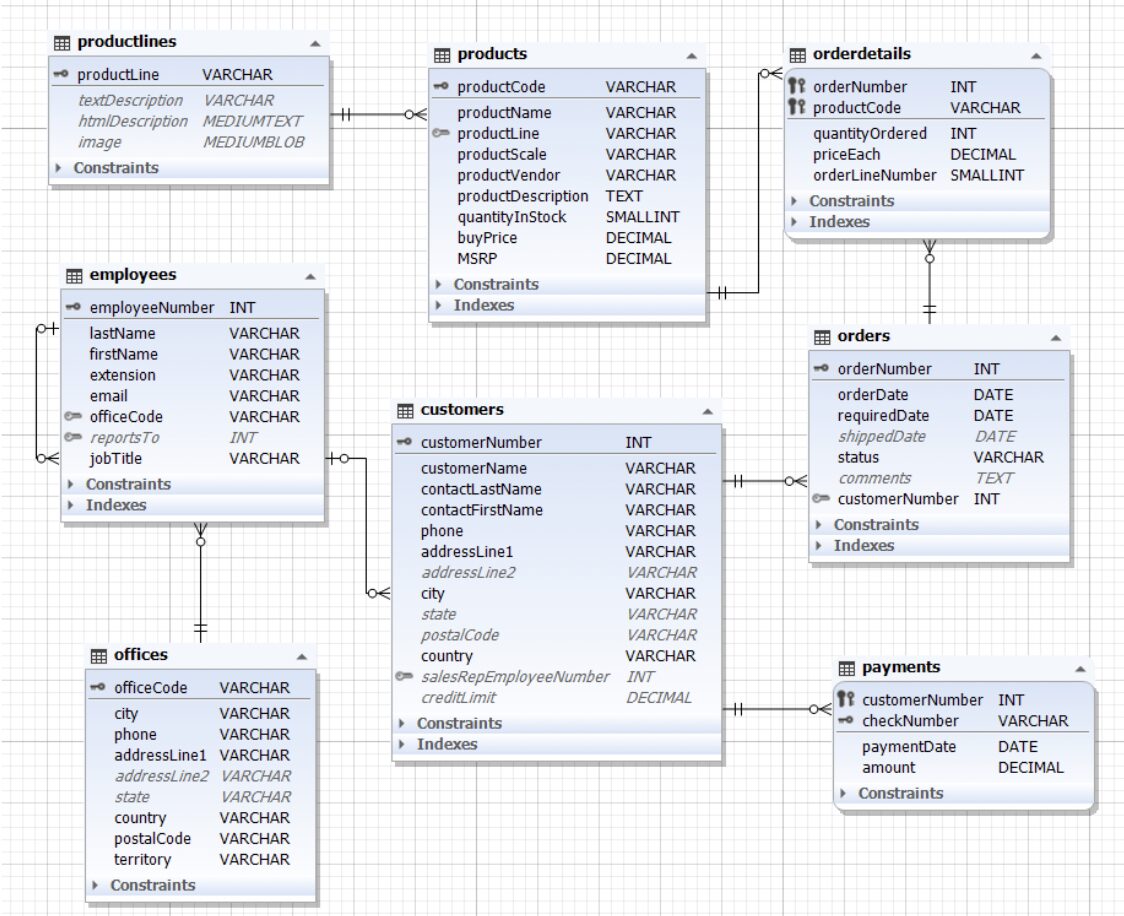
As you can see, it’s a classic data model for a transaction processing system, commonly used in many database-related examples.
Crafting Effective SQL Queries in dbForge Studio
The most common approach to start data analysis of this project is to run a query that will let us find the total sales for various product lines and products from different sales offices over a three-year period.
Here’s the query we are going to use:
| SELECT
pl.productLine AS “Product Category”, p.productName AS “Product Name”, o.orderdate AS “Order Date”, od.quantityOrdered AS “Order Quantity”, of.city AS “Office” FROM products p INNER JOIN productlines pl ON p.productLine = pl.productLine INNER JOIN orderdetails od ON p.productCode = od.productCode INNER JOIN orders o ON od.orderNumber = o.orderNumber INNER JOIN customers c ON o.customerNumber = c.customerNumber INNER JOIN employees e ON c.salesRepEmployeeNumber = e.employeeNumber INNER JOIN offices of ON e.officeCode = of.officeCode; |
As an output, we get the following results:
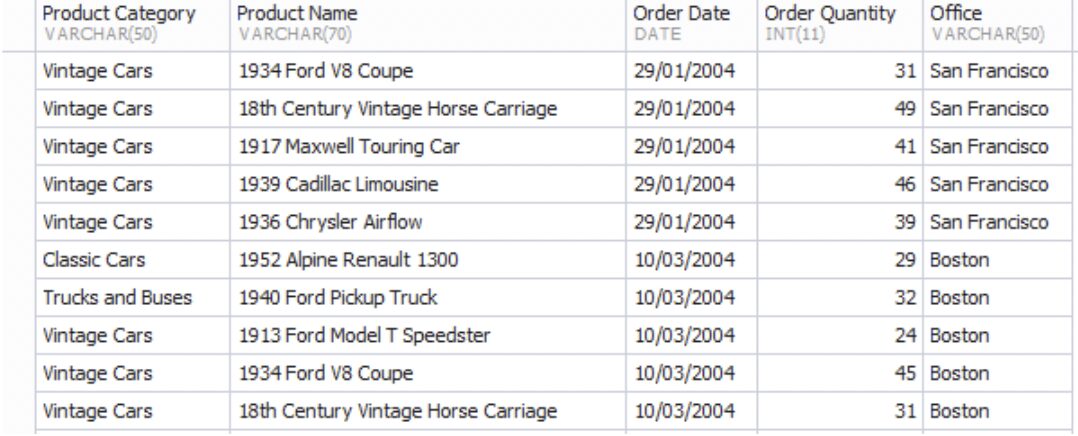
However, even though the dataset is comprehensive, it still contains numerous values. Naturally, one cannot derive insights from it just by reading it. For example, it’s impossible for us to make a year-to-year comparison for a specific category or compare how different offices perform against one another.
This dataset requires further analysis, and dbForge Studio for MySQL is the perfect tool to assist us with this task.
Leveraging the Pivot Table Feature in dbForge Studio
dbForge’s Pivot Table feature allows us to “pivot” rows and columns, just like it’s done in Excel. Once the data is pivoted, it becomes much easier to group, drill down, summarize, and filter. At the same time, you can send the query results to a built-in visualization tool to create charts.
To access the Pivot Table feature, we choose the Pivot Table option from the Database menu.
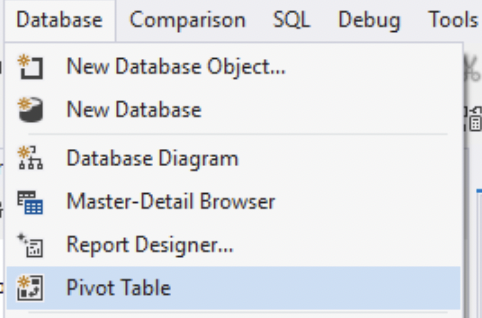
This command opens up an empty Pivot Table screen.
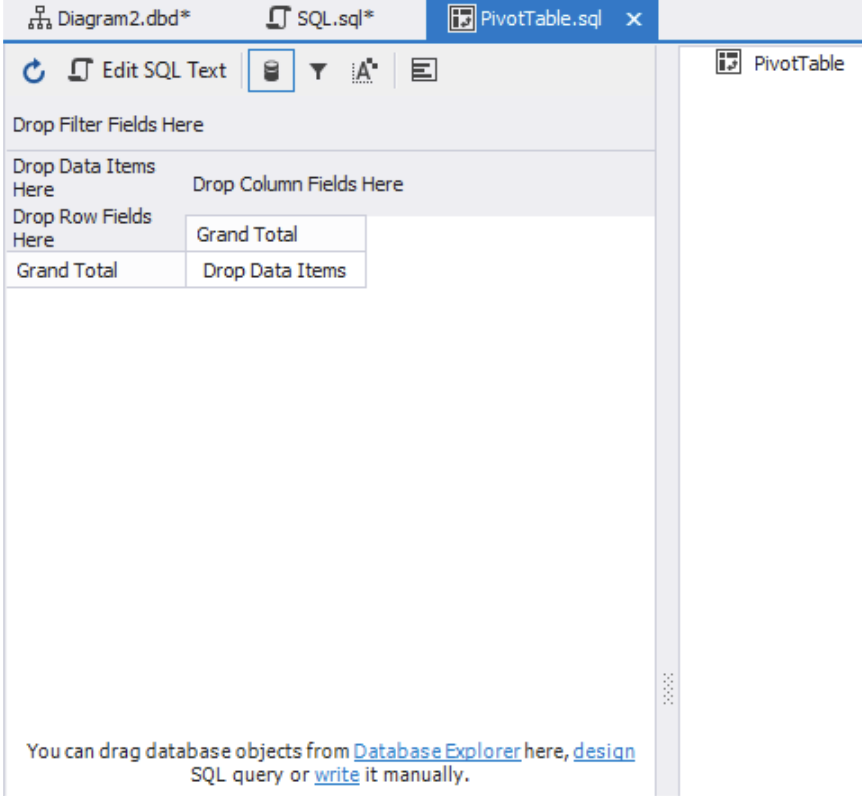
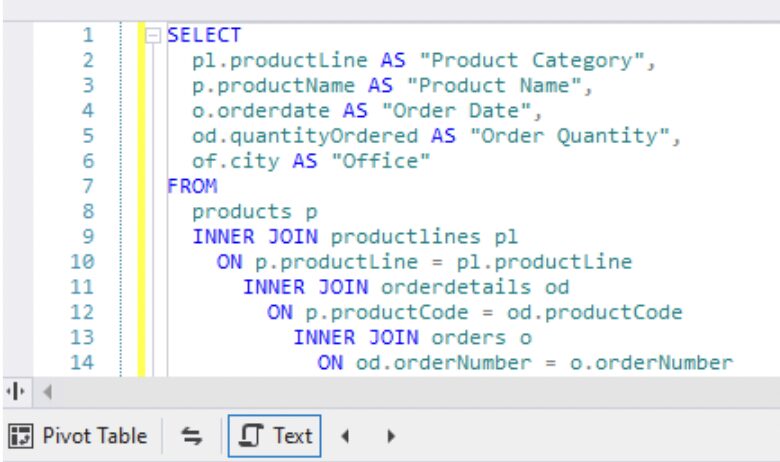
If we click the Edit SQL Text button, we will be able to access the SQL editor, which is located at the bottom half of your active window. As you can see from the image below, this is where we have added our query.
Note: you can build your own query just by dragging and dropping tables from the database explorer pane (the process is not illustrated here). However, we have created our query manually.
Click the Refresh button on the upper pane to display the fields in the data source view.
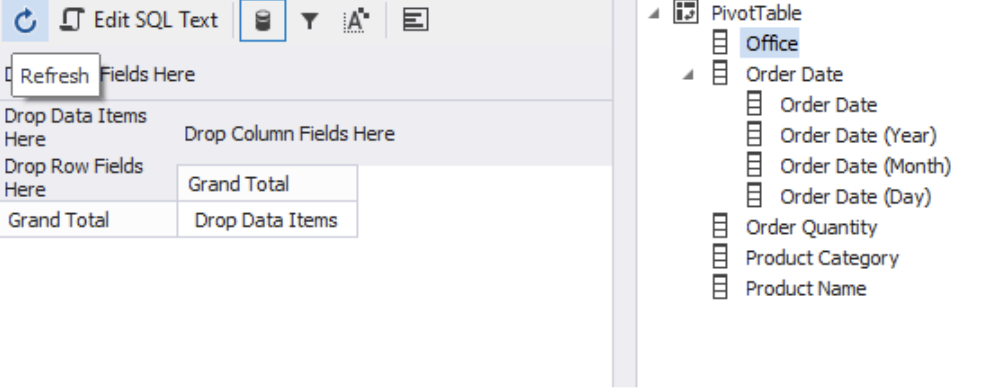
Notice how the fields are arranged alphabetically under “PivotTable” and how dbForge automatically decomposed the “Order Date” field into Year, Month, and Day.
Step-by-Step Guide to Building a Pivot Table in dbForge Studio
Now, it’s time to plan the structure of our pivot table. First, we have to ensure that it highlights all necessary data for useful insights and noticeable patterns.
We want to start by placing office locations in the row headers. For each office, we’ll display the product types sold, and for each product type, the individual products sold.
The column headers will show the years and months from the order date field. The result pane, on the other hand, will display the total number of units sold by a specific office for each product item in a particular month. At any time, we should be able to see these sales figures aggregated by year, product category, or office location.
Setting Up a Pivot Table in dbForge
Follow the guide below to create a pivot table that will let you highlight all the information described above.
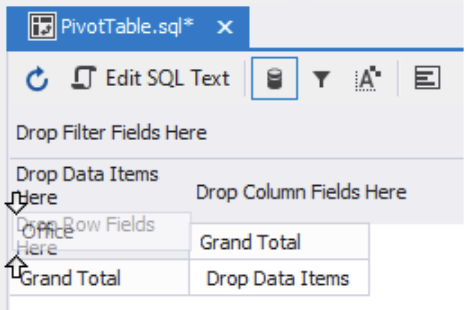
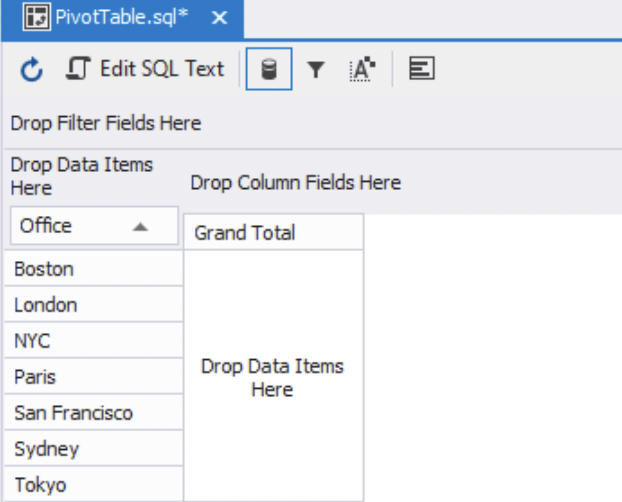
1) Start by dragging the Office field from the field list to the pivot table designer pane where it says “Drop Row Fields Here.”
 Immediately, the Pivot Table will display the distinct list of office locations.
2) Next, drag the Product Category field from the field list and place it below the Office field. Do the same with the Product Name field: drag it from the field list and drop it after the Product Category field. The rows will now be split by office location, product category, and product name.
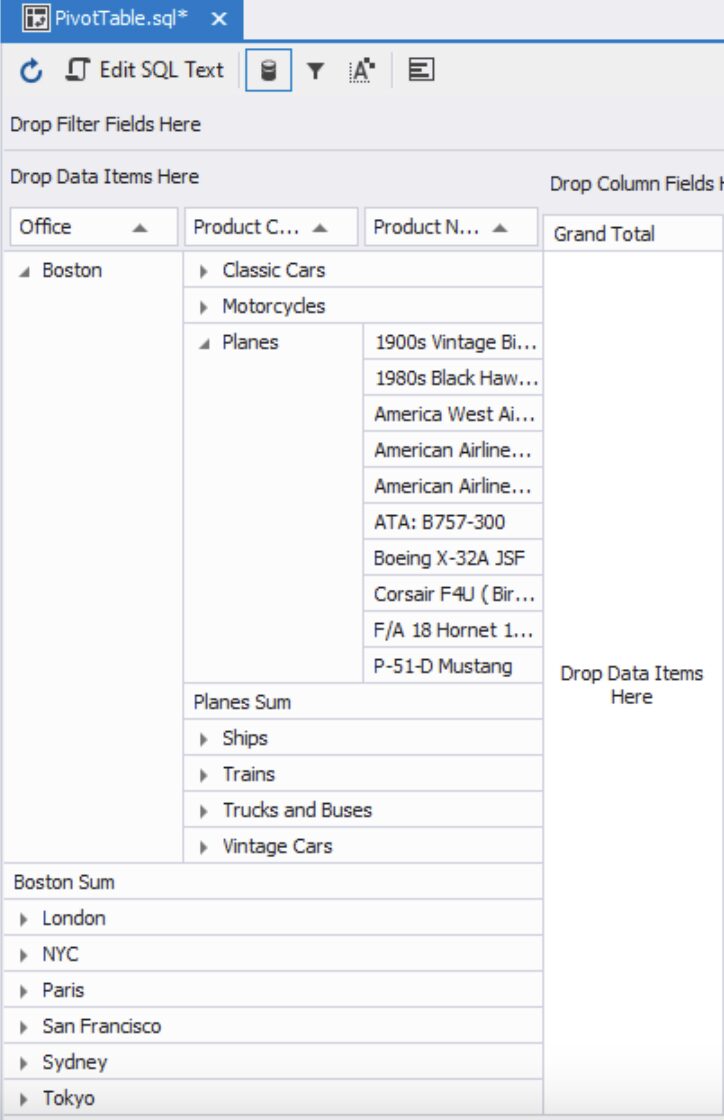
Note: as you can see, there are no fields in the columns section. To fix this, drag the Order Date (Year) field from the field list and drop it into the column header labeled “Drop Column Fields Here.” Next, drag the Order Date (Month) field and place it under the Order Date (Year) field. The pivot table will then become visible.

3) Finally, drag and drop the Order Quantity field to the main body of the pivot table where it says “Drop Data Items Here.” If you click the triangles in the row and column headers to shrink back, you will see the total figures.
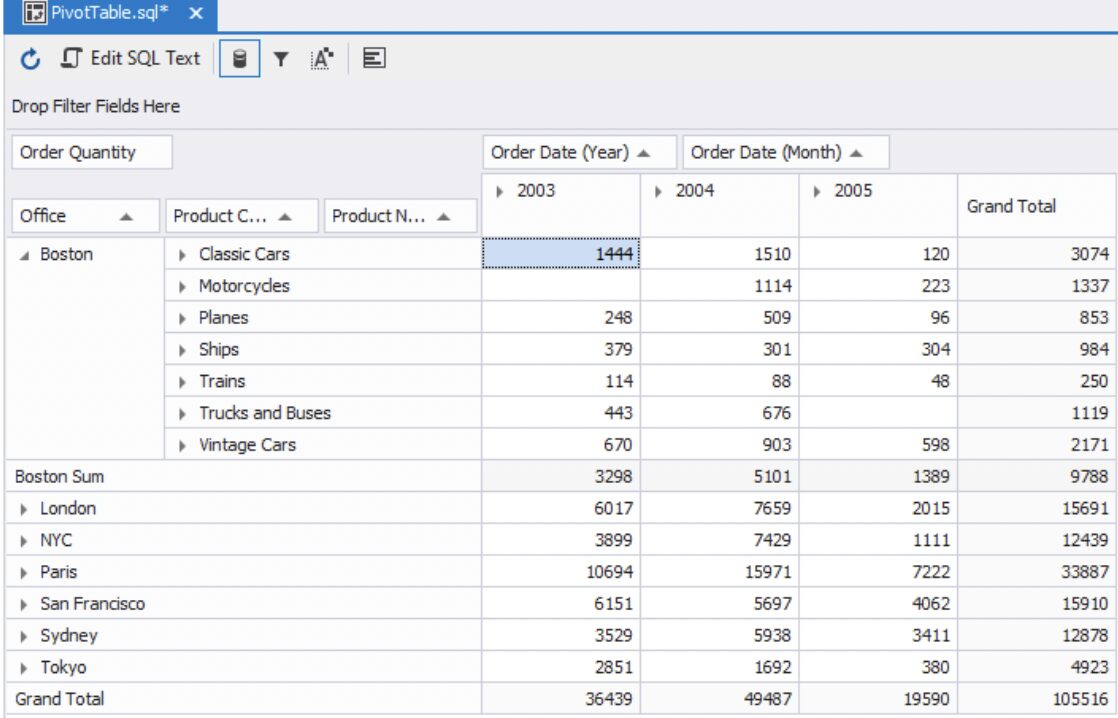
From here, you’ll be able to drill down and filter the data.
Filtering through the Pivot Table Data
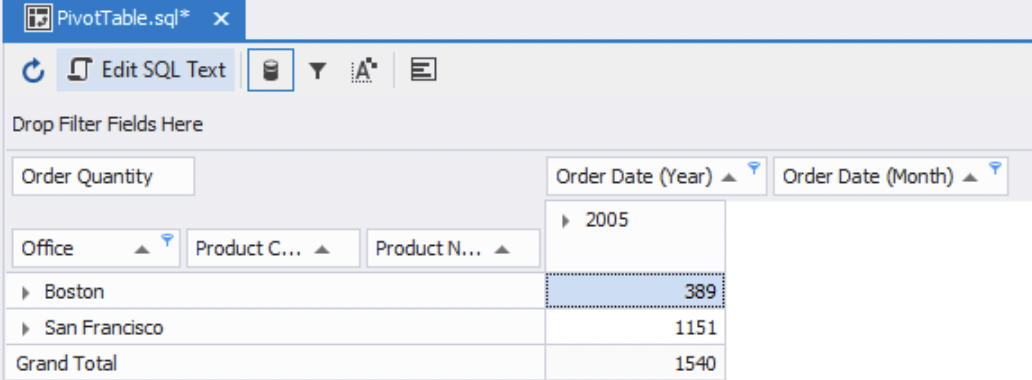
With our pivot table set up, we can now extract valuable insights. For example, let’s analyze the performance of the Boston and San Francisco offices in January 2005.
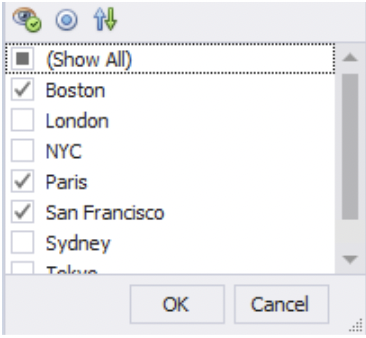
1) To get the figures, click the little funnel icon in the Office field’s header in the row and select the two office locations.

2) Next, select only 2005 from the Order Date (Year) and January from the Order Date (Month) column headers.
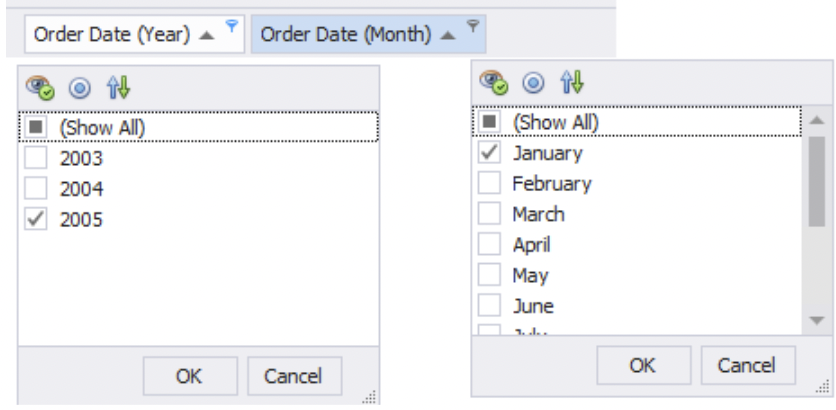
The pivot table now shows the total number of products sold in that particular month and year from those two offices. As you can see, San Francisco sold almost three times more than Boston. Also, note how the blue funnel icons highlight the fields that have been filtered.
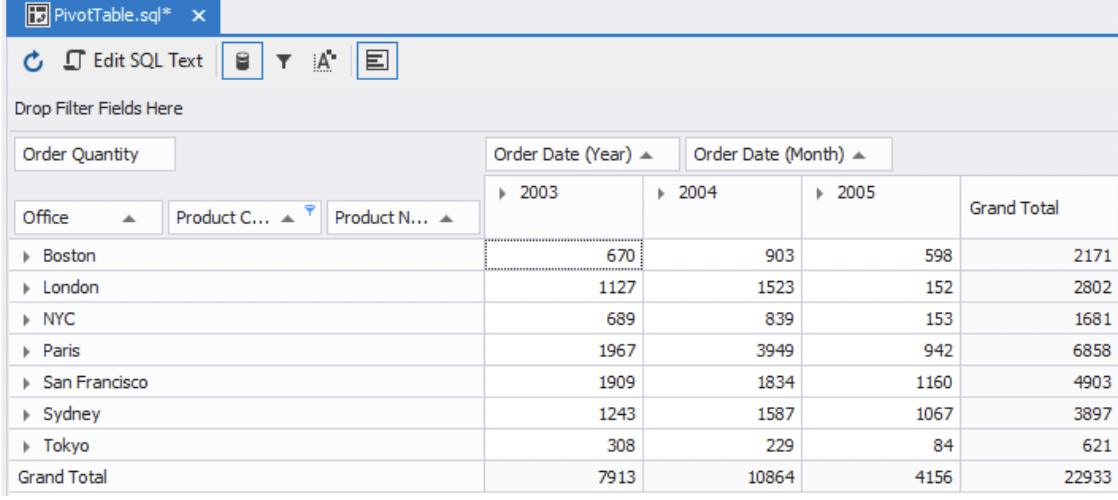
Let’s take this a bit further. Let’s say we want to see the year-to-year performance of all the offices for a particular product category called “Vintage Cars.”
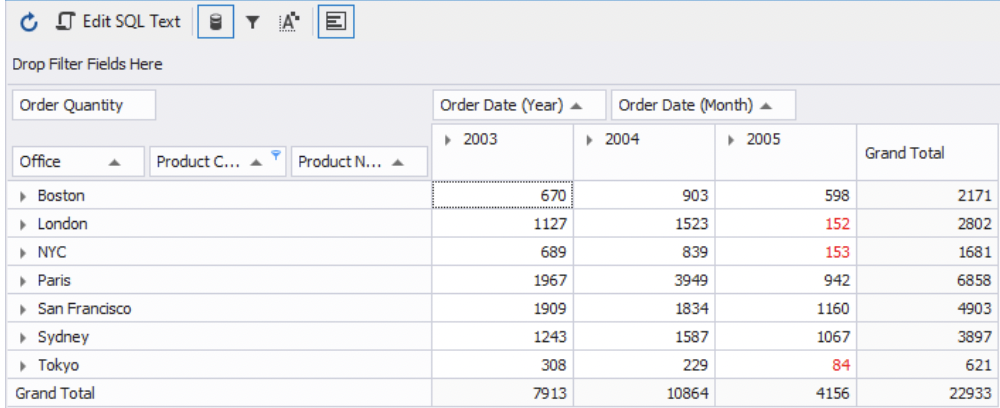
1) Select back all the offices and all three years from the column headers. We then select only the Vintage Cars product category from the Product Category row header. Finally, we ensure none of the field headers are expanded. The pivot table should look like this:
2) Now let’s click the Show Chart button from the toolbar:
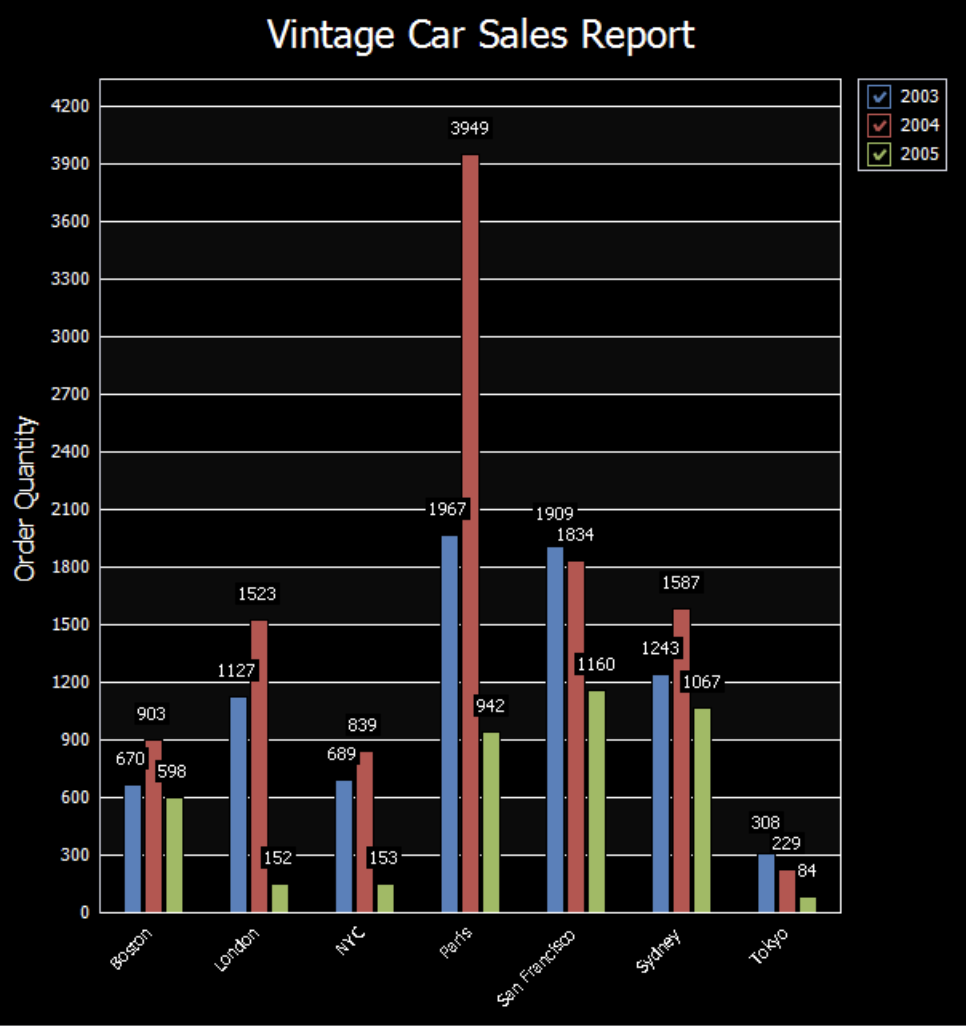
The chart pane appears with a bar chart:
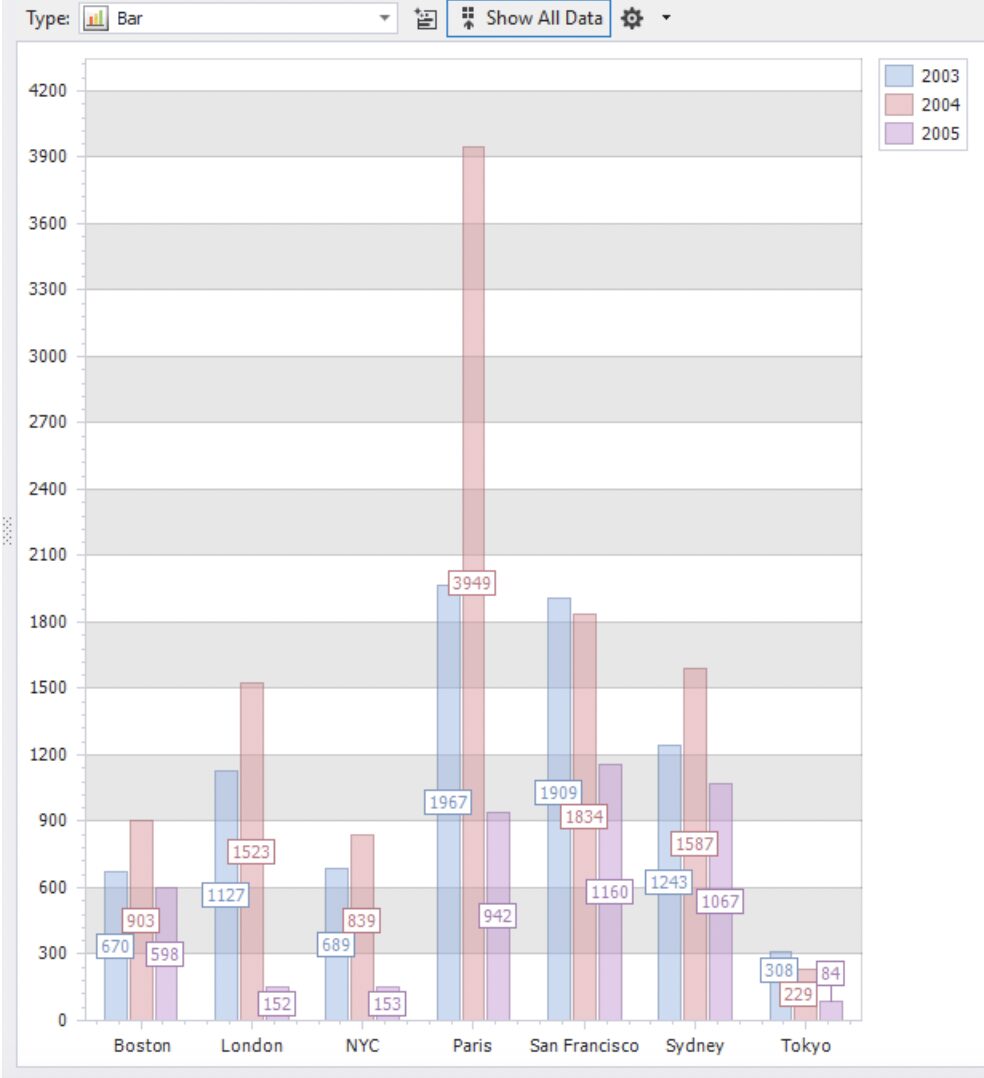
Immediately, we can see that the Paris office had the best sales in 2003 and 2004, but it fell behind in 2005. The best sales figure in 2005 was from the San Francisco office.
You can experiment with the different types of charts by selecting them from the Type drop-down list, but we advise you to keep it as a simple bar graph and click the button on the left side where it says Show All Data. This opens up the chart designer:
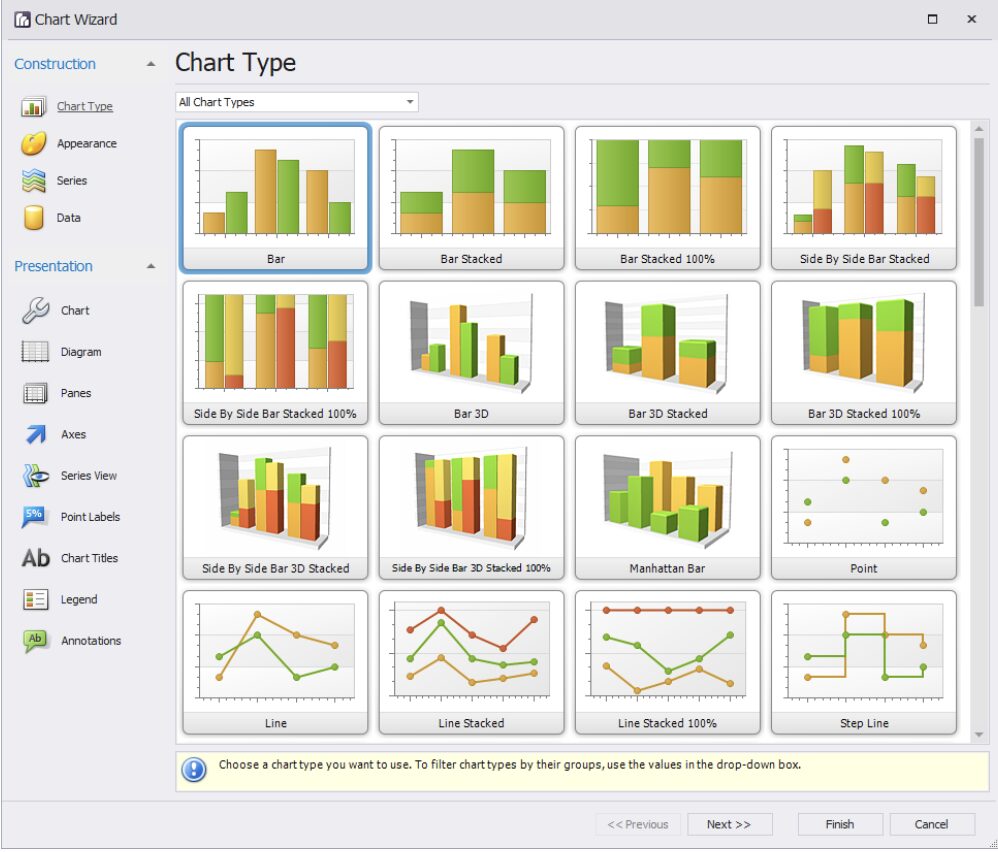
Note: The dbForge Chart Wizard has so many options that it can become the subject of another article. However, you can create a final chart by selecting a few different options and making a little customization by using its intuitive interface.
As you can see, we have a nice analytical report here. Both the chart and the data supporting it come from a tabular resultset of a query we wrote before.
Conditional Styling in dbForge Pivot Table
Another thing we can do with our pivot table is perform conditional styling, just like in Excel. Let’s explore how it works in dbForge.
First, create a conditional style to highlight sales figures where units sold are less than 200:
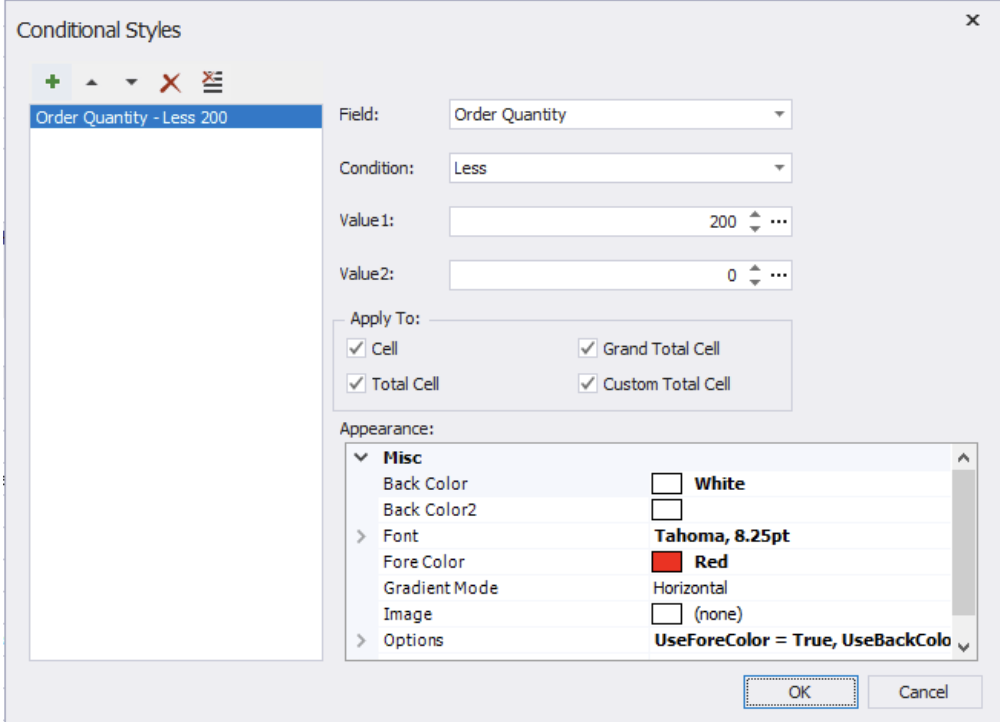
The table now looks like this:
Last but not least, it’s time to save the pivot table. When saving a pivot table with a chart, dbForge Studio for MySQL creates two separate files: one is an SQL script, and the other is an XML representation of the graphical chart. The script can be opened at any time, and the pivot table data can be refreshed for it. You can then start a further analysis or share the files with other dbForge users.
Final Words
This was a simple introduction to dbForge Studio’s Pivot Table feature with a limited dataset and a simple query. But as you can see, the software offers some great features to slice and dice data and build visualizations from pivoted values. This approach can be useful for more realistic workloads like clickstream data analysis, high-volume transaction reporting, or year-to-year KPI comparisons. Try dbForge for 30 days to learn how its advanced functionality can level up your reporting and data analysis routines!