Based on technical analysis, Dogecoin’s current momentum could soon end with a pronounced move in either a bullish or bearish trend. The technical indicator and chart pattern suggest various periods of volatility. Tradecurve is also being analyzed, where data suggests that it could reach a bullish run, as it’s currently in the green zone.
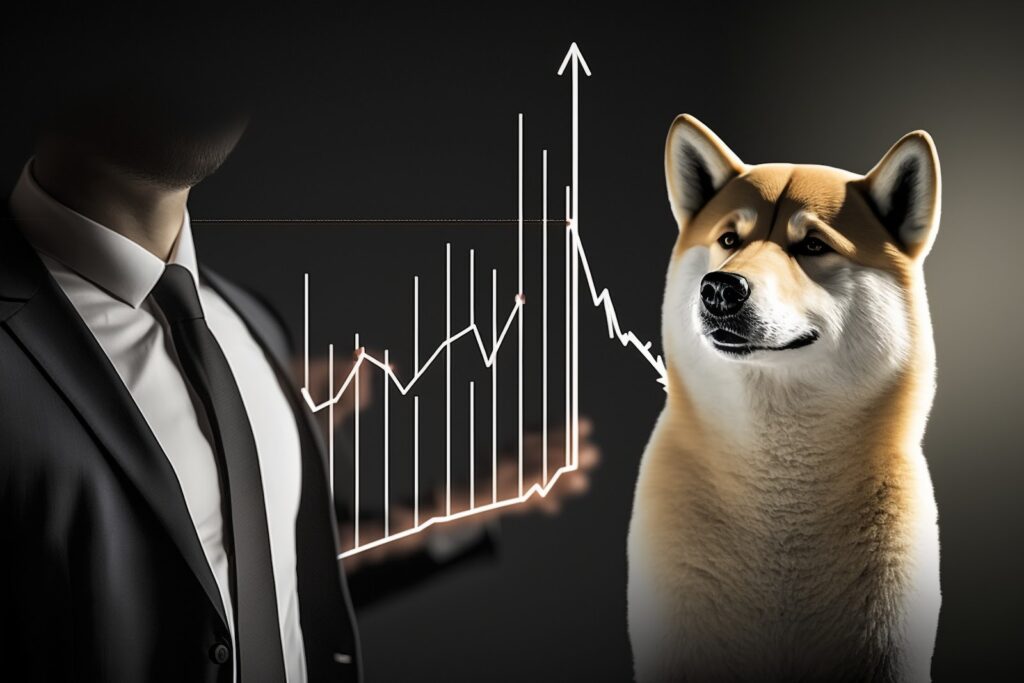
Dogecoin Experiences High Volatility In Its Chart Patterns
The Dogecoin chart pattern currently indicates a downtrend in its value. The cryptocurrency has been declining ever since it reached an all-time high on May 8, 2021, at $0.73. This downtrend was initially interrupted by a few short-term rallies.
However, the overall trend has remained bearish. There are technical indicators that suggest the downtrend can continue. The 200-day moving average is heading downward, indicating a bearish signal. The RSI is also below 30, showcasing oversold conditions. Typically, these oversold conditions can lead to a short-term rally but not affect the overall trends.
There are factors that can support a bullish reversal, however, as the price is nearing the support level of $0.07, and if the price can hold above this level, it can trigger a rally. The Dogecoin community is also still very active, and there is a lot of support for the cryptocurrency. On June 6, 2023, Dogecoin traded at $0.066742.
In the past 30 days, Dogecoin has been down by 13.4%. If Dogecoin breaks past $0.07, we can see a bullish pattern ahead, but investors still need to be careful.
Tradecurve Gives Bullish Signs And Is in The Green Zone
Tradecurve is an innovative platform for trading that combines the best elements found in CEXs and DEXs and enables users to effortlessly trade not just crypto but any other derivatives, including CFDs, stocks, forex, indices, and commodities, all from a single account while maintaining a complete level of privacy through the platform’s DeFi capabilities.
Traders gain access to a comprehensive range of trading tools and educational resources, such as low latency execution, algorithmic trading systems that are integrated with AI, and social trading. There’s also high leverage starting at 500:1, negative balance protection, a VIP account service, a dedicated Trading Academy, and Proof of Reserves (PoR) implementation.
Users are not required to complete KYC requirements to use Tradecurve and can just connect their wallet, deposit crypto, and then use it as collateral when making trades. The TCRV utility token has showcased green signs, as it is up 25% in value within the past week.
During Stage 3 of the presale, TCRV trades at $0.015 per token, and analysts predict that it can jump in value by 50x during the presale and 100x at launch. This makes TCRV one of the best investment opportunities for 2023 and beyond, as it can rocket in value and provide significant returns.
Learn more about Tradecurve and the TCRV token below:
Click Here To Buy TCRV Presale Tokens
Join Our Community on Telegram