The whole market will have a greater fear index for the first time in 2021. Bitcoin price has fallen 27% over the last ten days, making it the largest ten-day loss since the March 2020 collapse and the second-largest since November 2018. Amidst the heavy selling, Microstrategy Incorporated announced it acquired an “additional $10 million in Bitcoin at an average price of $43,633, lifting total holdings to 92,079 BTC for $2.251 billion with an average price of $24,450.”. Apart from these big market cap coins, CLEVER could be one of the coins which can save your day and give strength to your portfolio.
CLEVER is a DEFI (Decentralized Finance) Protocol that distributes AUTOMATIC INTEREST PAYMENTS to all CLVA Token Holders on a pre-programmed routine cycle schedule over 888 fortnightly cycles taking exactly 34.15 years to complete.
CLEVER (CLVA) Price Forecast | Updated May 2021
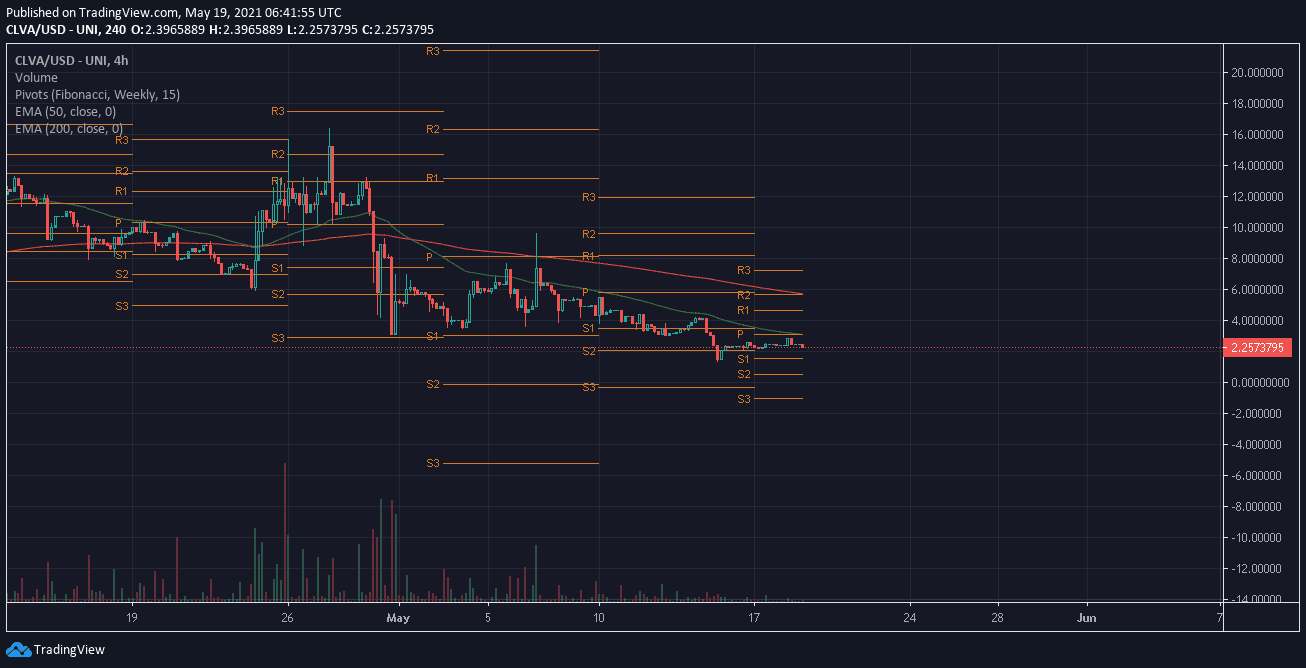
Exchange: Dextools.io
Time interval: 4Hour
Pair: CLVA/USD
Indicators: EMA (Exponential Moving Average) – 50-200
Pivot – Fibonacci X Weekly
As the whole market looks bearish, still this coin has the potential to jump back any time because of strong holding from users and community support.
Though EMA 50-200 gives a bearish golden cross since the beginning of the month, a strong Fibonacci retracement can be seen in the coming few days.
Possibilities of Fibonacci retracement for CLEVER (CLVA) | Crypto Price Forecast May 2021
Well, Fibonacci retracement is a very popular technical indicator used by most professional traders to take an estimate about when and where a strong correction may happen.
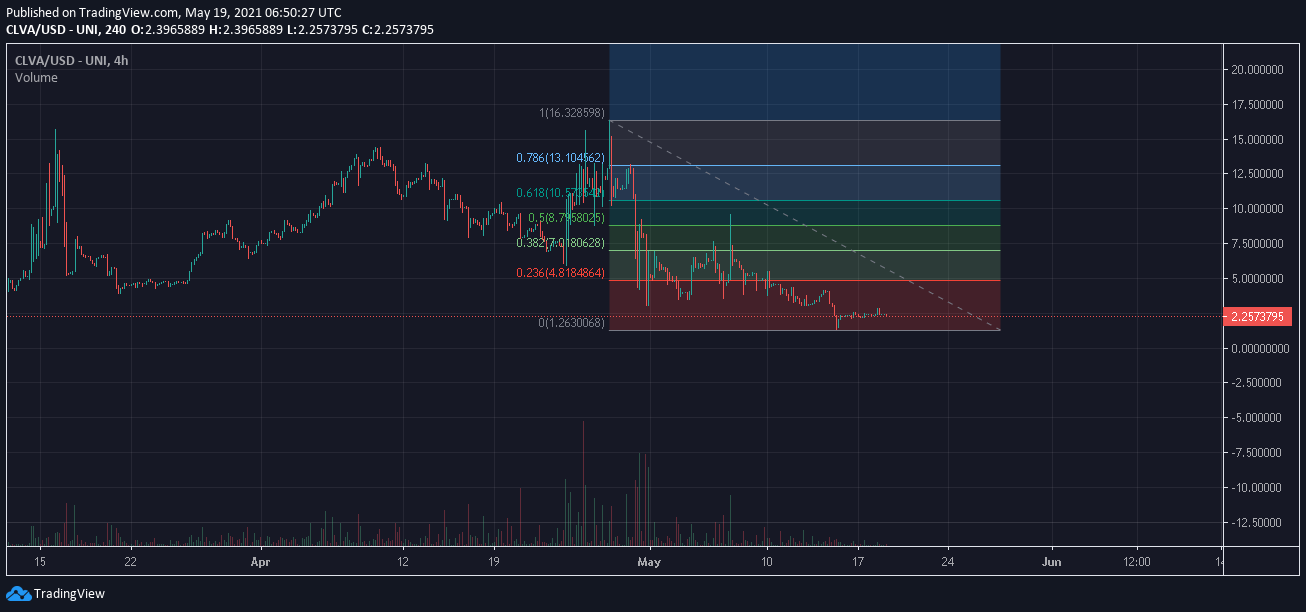
As $CLVA has already made an all-time low and is now regaining momentum, the Fibonacci retracement technical indicator can give you an estimate of at what level it can pullback in the next few days.
From the above chart can see, it can have a price jumping back to 8.7$ (as per the Fibonacci retracement fundamental 50% retracement likely to happen after a strong fall in the price in a monthly time frame.
What RSI and MACD says about the $CLVA Coin
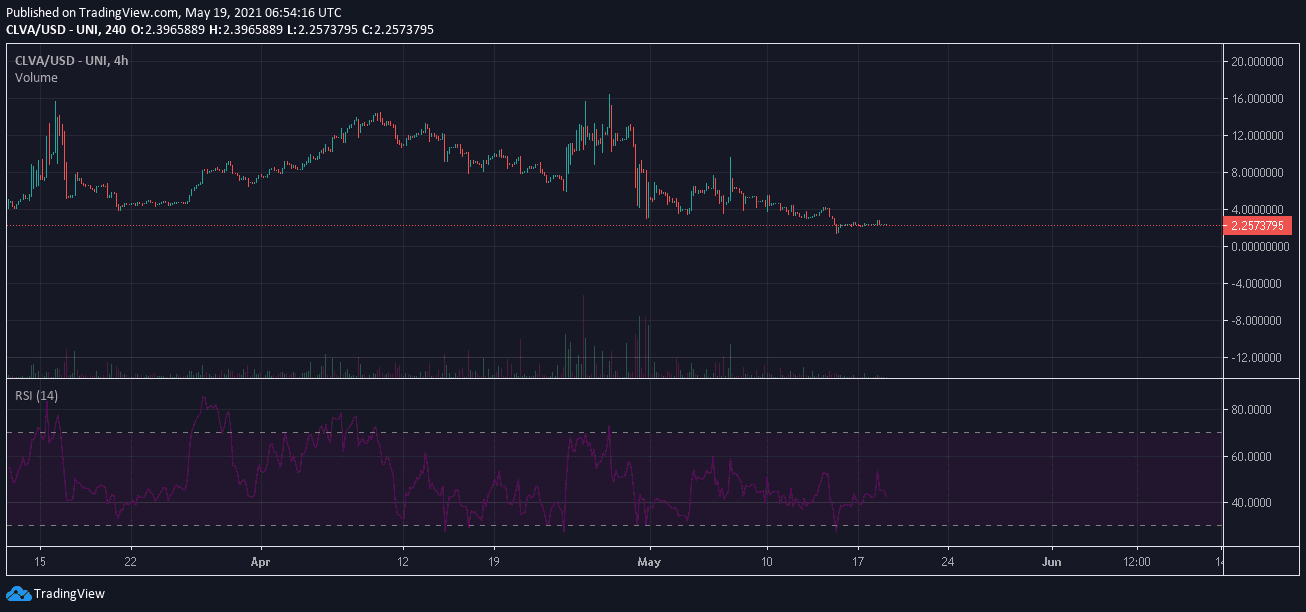
RSI (Relative Strength Index) technical indicator is another popular technical indicator used to determine the “Overbought” or “Oversold” situation in the market. According to the fundamentals, if the RSI is 40 then the coin is likely to be oversold because of fear or bad market conditions.
Hence in such cases price likely to jump back to a very significant level i.e 8.7$ in this case.
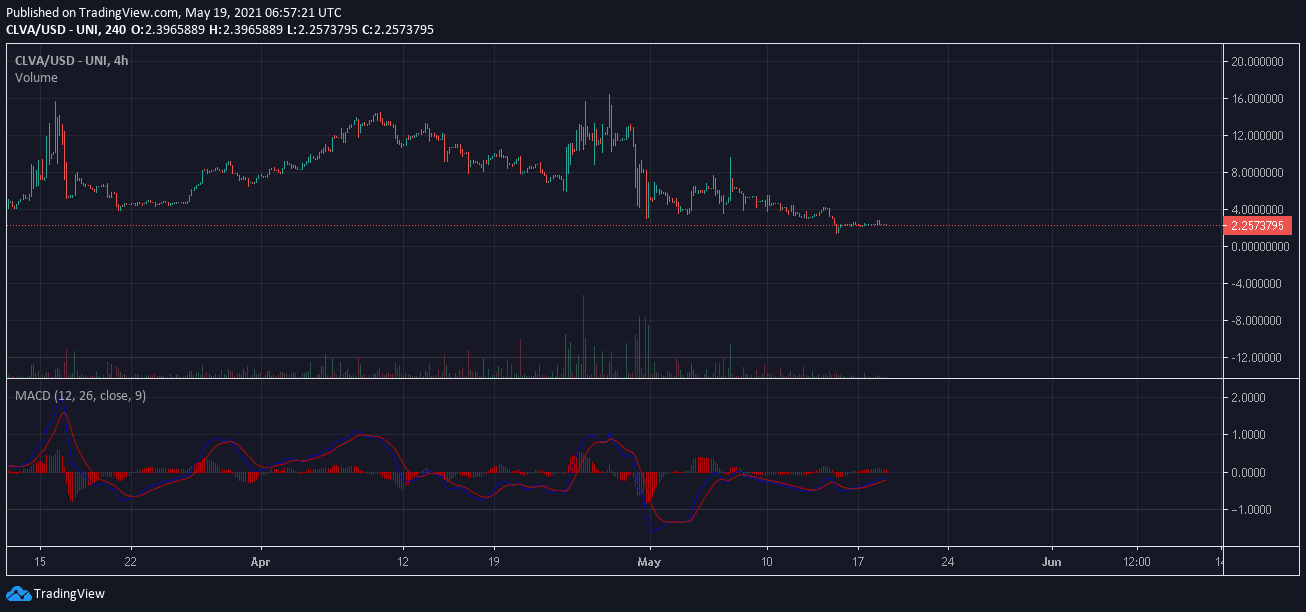
MACD turned out to be BULLISH since 13th May, despite a bear market right now, users are actually buying the coin at discounted rates.
Conclusion
Investors can think of the project as a smart way of storing their wealth with minimal risk. Instead of the dismally low interest paid out by banks and other traditional instruments, CLEVER plans to step it up for smart investors and pay above rate, attractive yields sustainably over a defined period.
Through CLEVER, there is a means of tapping above-industry rates of interest from holding and contributing to the ecosystem.