Bitcoin price might pull back before it continues its uptrend.Ethereum price is facing a critical resistance level at $2,018 and might retrace before heading higher. Ripple price is bouncing off a demand zone ranging from $0.548 to $0.568.
Defi market looks weak and some of the sustainable projects like CLVA are holding strong on their support. Lets see a technical analysis of CLVA with different technical indicators, scalping and swing trading setups.
MACD started the Bullish signal
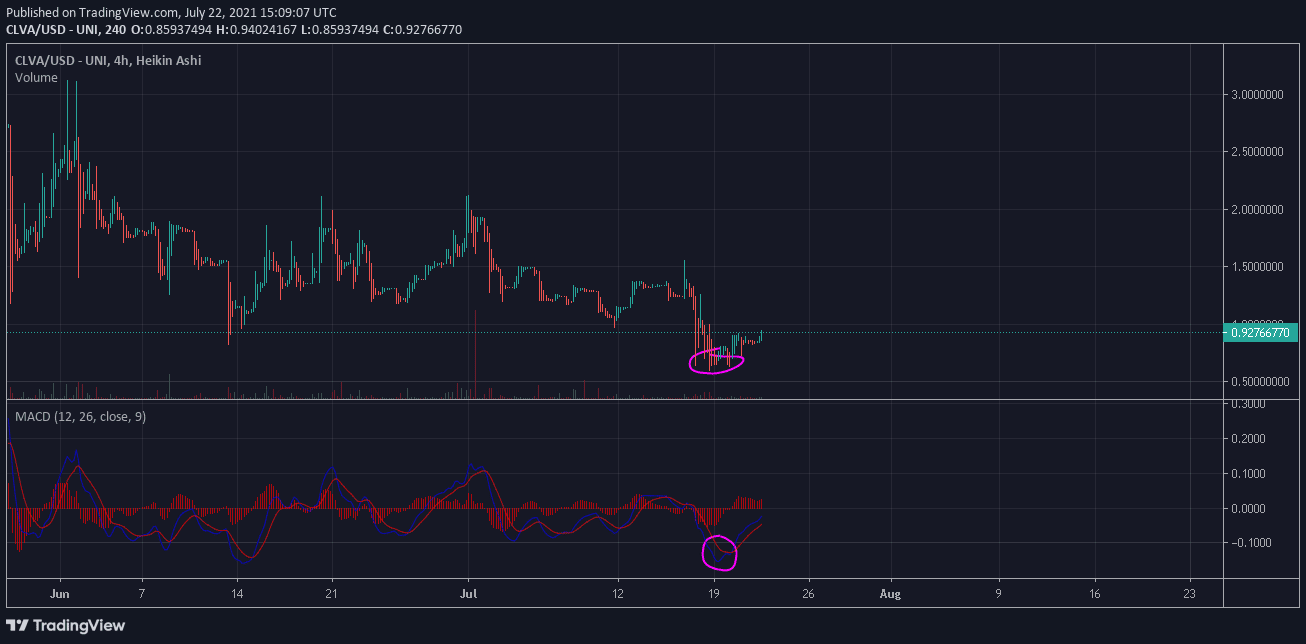
After making a new low, the whales and even retain investors have started buying CLVA again. This made a strong pull back in the price from 0.6$ to 0.9$ in a very short period of time. This pullback can be due to a small market recovery after ELON said that SPACEX hold BTC and ETH and he also holds both the assets and is not willing to sell as of now. He also said “I pump the market but don’t dump it”, “Tesla may accept BTC and even ETH in future” he added.
Fibonacci Retracement can make the price climb up to 1.8$
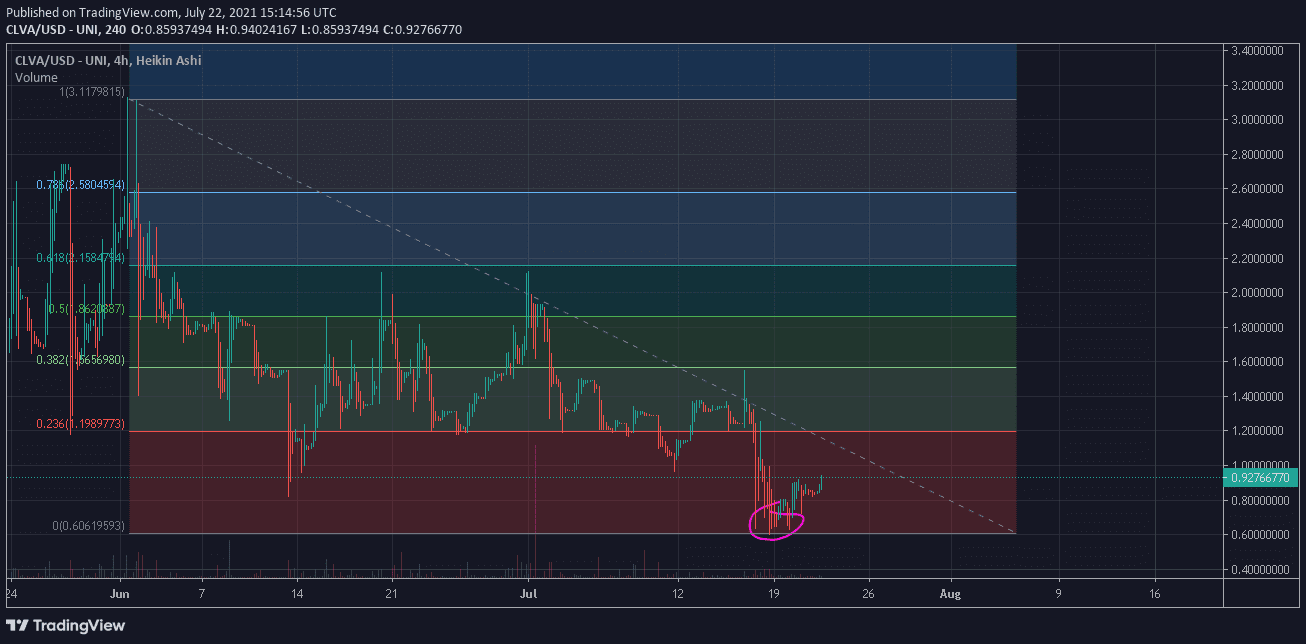
Fibonnaci retracement is one of the strongest indicators among daily or traditional traders. Applying it to the CLVA chart as shown above, is indicating that a pull back or a correction can be seem very soon which will be upto 50% level i.e. upto 1.8$ mark (Could be $2 as the $2 mark is a psychological resistance to CLVA as of now)
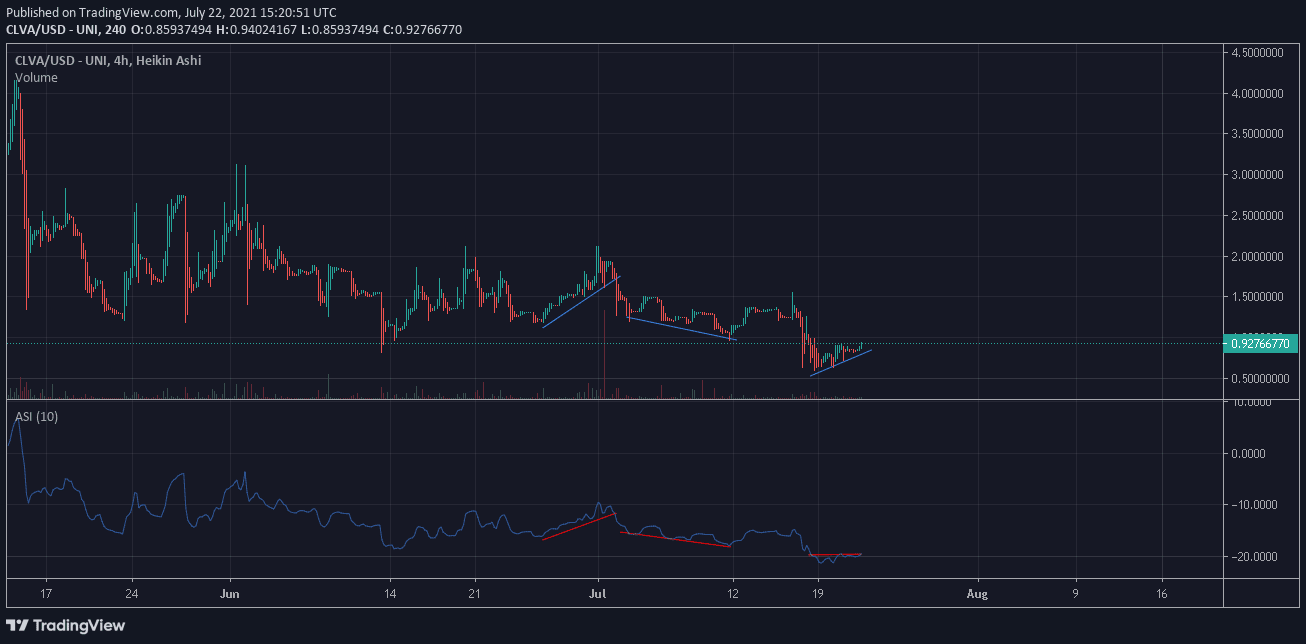
What the Accumulative Swing Index Tells You
The Swing Index Value is then accumulated to form the Accumulated Swing Index trendline. This trendline value typically falls within a range of 100 to -100. As a price-centric index, it will generally follow the candlestick pattern of a price. The Swing Index and ASI can be used in analyzing all types of securities. It is often used for futures trading but can be used for analyzing the price trends of other assets as well. In the case of CLVA technical analysis, the price is not behaving according to the ASI, like it use to previously. This could be due to sudden recovery in the market. Though this is usual and can be see in other asset classes as well.
Bollinger Band and RSI can tell more about the price action

As you can see in the chart above, the candle in 4 hour chart is slightly touching the upper walls (limit) of the BB, which means there might be a small decline in the price soon, but RSI stands below 60 level clearly indicates the buyers strength to enough to pull the price upwards.
Clever Defi Resistance and Support Levels (24 hours)
Classic
R3 : $1.20422
R2 : $1.09435
R1 : $1.03961
Pivot : $0.92974
S1 : $0.87499
S2 : $0.76513
S3 : $0.71038
Fibonacci
R3 : $1.09435
R2 : $1.03147
R1 : $0.99262
Pivot : $0.92974
S1 : $0.86686
S2 : $0.82801
S3 : $0.76513
Camarilla
R3 : $1.03013
R2 : $1.01504
R1 : $0.99995
Pivot : $0.92974
S1 : $0.96977
S2 : $0.95468
S3 : $0.93959
What is CLEVER DEFI (CLVA)?
CLEVER is a DEFI (Decentralized Finance) Protocol that distributes AUTOMATIC INTEREST PAYMENTS to all CLVA Token Holders on a pre-programmed routine cycle schedule over 888 fortnightly cycles taking exactly 34.15 years to complete.
Up to 11% Compound interest PAID FORTNIGHTLY with guaranteed automatic payments for all CLVA Token holders
Think of CLEVER as the digital smart way to STORE YOUR WEALTH which pays a significantly greater interest rate compared to a now outdated everyday bank account paying little to no interest.