This article lays out a practical, step-by-step method to train yourself – using AI. You’ll learn exactly which prompts to use in tools like GPT or Gemeni to train yourself to study an industry, break down real business problems and solve them like a pro. It’s a self-teaching system that helps you think analytically, act strategically and apply what you learn to real-world challenges.
The Limitation Of Technical Proficiency
A lot of tech specialists are overtrained in software, but undertrained on impact. The educational market is saturated with certifications and tutorials – most of them anchored in UI mechanics: how to drag and drop, format and publish.
What they fail to address is the analyst’s true leverage point: the ability to convert ambiguous business problems into analytical frameworks, translate metrics into decision paths, and design visual outputs.
This is the central premise behind the methodology I developed: a self-trained system leveraging AI that teaches data professionals to operate with precision, depth, and contextual understanding of a problem.
Why the Traditional Training Model Fails
The current training ecosystem is backward. It assumes mastery tools are equal to mastery outcomes. This logic is flawed.
Visualizing metrics is not the same as understanding their causality. Formatting a bunch of charts and putting them in one place is not equivalent to solving a business constraint. You don’t close revenue gaps with colour palettes.
The core missing component? The thinking. The deep understanding and knowledge of both – the content of a client’s problem and analytical methods to solve it.
Analysts must be trained to model the business itself: its value drivers, behavioural patterns, and industry-specific problems. Without this foundation, technical knowledge becomes a small part of the value that is required.
Another factor is that I truly believe that the value of how-to content will subside as LLMs become the answer to the vast majority of technical problems. With the here-and-now answer and explanation you need.
That’s why in my methodology of becoming a self-taught consultant I am leveraging AI to show how it can transform and revolutionize education by explaining something that people would have to learn the hard way many years before.
A Structured Model for Self-Training
This framework is designed to replace passive learning with simulated by AI use-case scenarios of different business problems. It gives the unprecedented opportunity to pass years of experience that before have to be gained by a practical career and get into the core, the essence of the knowledge that defines an exceptional professional.
So here are the steps:
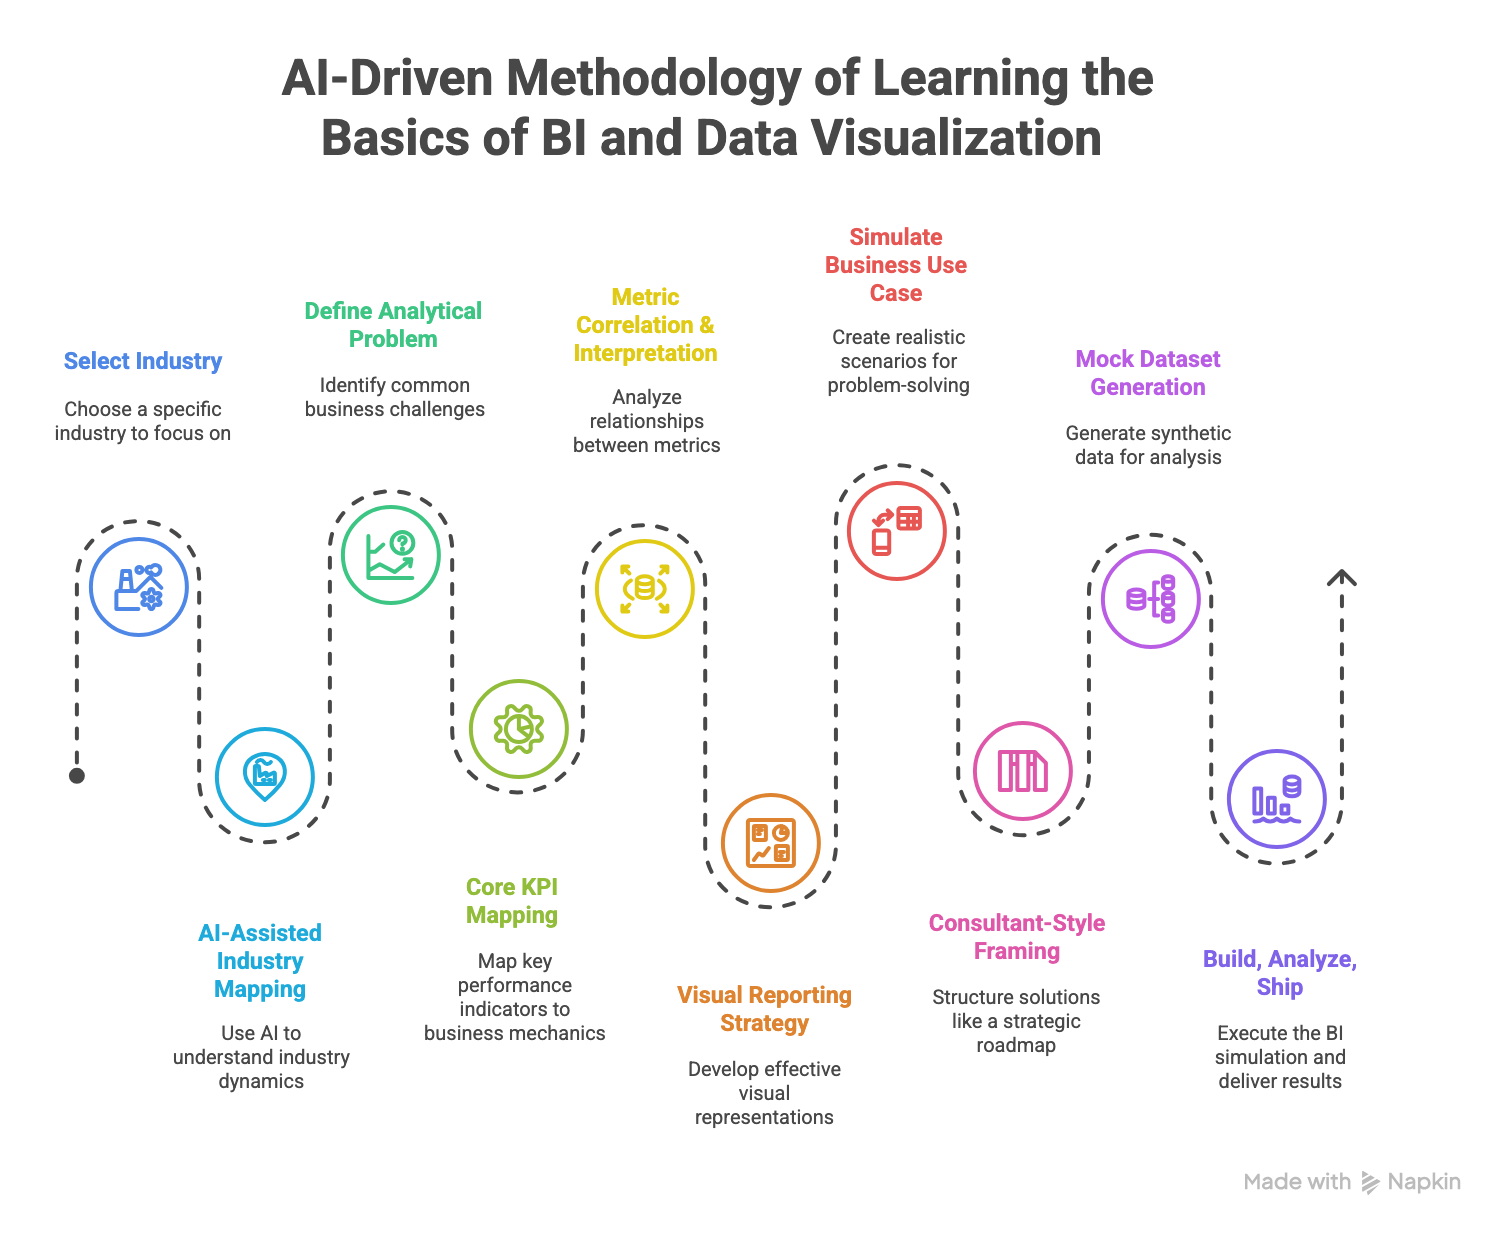
Step 1: Industry Grounding – Building Operational Fluency Within a Specific Industry.
The first step should be just picking one industry or domain and learning about it with any LLM models like ChatGPT. The goal is not domain knowledge for trivia night – it’s operational fluency.
Prompt example:
Explain the key business models, revenue streams and operational challenges in the , (for instance, e-commerce, retail, manufacturing etc )industry from an analytical perspective. List the top 10 metrics used to evaluate performance.”
Step 2: Ai-Assisted Industry Mapping – Learn How Value Is Created and Measured in the Chosen Domain.
Begin by leveraging LLMs to construct a high-level analytical framework as an instance for the e-commerce sector. Identify the revenue drivers operational constraints. Use this to understand how values are created, where inefficiencies emerge, and which metrics correlate with which commercial outcomes.
Prompt example: “What are the typical revenue drivers and cost centers in a mid-size e-commerce company? What metrics are used to monitor them?”
Step 3: Defining the Analytical Problem – Surface the Most Common Business Problems Analysts Solve in That Domain.
Defining the analytical problem space prompts AI systems to surface common business.
Examples might be high customer churn rate, multi-channel attribution inefficiencies, margin decrease, inventory imbalance and under-demand shifts.
Prompt example:
“What are the most common analytical challenges in the e-commerce industry? Break them down into categories: acquisition, retention, operations and finance”
Step 4: Core KPI Mapping – Identify High-Leverage Metrics Tied to Business Mechanics
Move beyond surface-level metrics. Focus on diagnostic KPIs—those that reflect levers, not just outcomes.
Your job is to map metrics to the mechanics of the business: what drives acquisition, conversion, retention, and margin at each stage of the funnel.
Examples:
- Customer Lifetime Value (CLV) = AOV × purchase frequency × retention rate
- Gross Margin % = (Revenue – COGS) / Revenue
- Inventory Turnover = COGS / Avg Inventory
Group KPIs by business function:
- Acquisition → CTR, CPC, ROAS
- Conversion → AOV, Checkout Drop Rate, Funnel Conversion
- Retention → Repeat Rate, Churn %, LTV
Prompt example:
“List and define diagnostic KPIs for [industry], grouped by business function. Include formula breakdowns and explain how each metric is used for decision-making.”
Step 5: Metric Correlation & Interpretation – Uncover Patterns, Causality, and Noise
This step builds systems thinking.
Start by identifying which metrics tend to move together—and why.
For example:
- High AOV + Low Conversion Rate → pricing or UX friction
- Declining ROAS + stable revenue → improved organic or brand traffic
- Inventory Turnover ↓ + GM% ↑ → stockpiling or margin control
Layer in time-series logic:
Are trends structural or seasonal? Are fluctuations noise or signal?
You’re building the muscle to diagnose root causes, not just describe symptoms.
Prompt example:
“In [industry], what are examples of metric pairs that commonly move together? Explain what these shifts usually indicate, and how to distinguish causal trends from noise.”
Step 6: Visual Reporting Strategy – Engineer Visual Logic, Not Decoration
Each chart should serve a diagnostic or directional purpose.
The goal is decision alignment, not decoration.
Examples:
- Line charts → for time-dependent trends (e.g. 7-day average conversion rate)
- Clustered bars → for channel/campaign comparisons
- Scatterplots → for identifying outliers or correlation (e.g. AOV vs. session duration)
- Heatmaps → for layered behavior insights (e.g. churn rate by region + cohort)
Think about chart + annotation combos. Your role is not just to visualize—but to guide interpretation.
Prompt example:
“Suggest best-practice visual strategies for presenting time trends, correlations, and segmentation breakdowns in executive dashboards. Include use cases and decision contexts.”
Step 7: Simulate a Business Use Case – Generate Domain-Specific Scenarios With Clear Stakes
Time to stress-test what you’ve learned.
Ask the AI to build a real scenario—ideally one with unclear causes and multiple potential levers.
Examples:
- ROAS is dropping despite flat spend
- Repeat purchase rate is declining in high-CLV segments
- Conversion rate is stalling post-product update
The goal is to simulate multi-layered problem-solving, just like you’d face in a consulting engagement.
Prompt example:
“Generate a realistic business case for a BI consultant in the [industry] space. Include business background, data symptoms, and the strategic stakes of solving the problem.”
Step 8: Consultant-Style Framing – Structure Your Solution Like a Strategic Roadmap
You’re Now in Problem-Solver Mode.
Outline the solution the way a senior BI consultant would.
Structure:
- Objective: What’s the business goal? (e.g. restore conversion lift, reduce churn)
- Hypothesis: What might be driving the issue?
- Analytical Plan: Which metrics will you analyze? How will you segment?
- Question Map: What does the dashboard need to answer?
- Visual Design: What structure tells the story best?
Think like a strategist with a data toolbox—not the other way around.
Prompt example:
“Given the use case [insert], outline an analytical approach: KPIs, hypotheses, core questions, and dashboard structure aligned to business decisions.”
Step 9: Mock Dataset Generation – Build Synthetic Data to Simulate Real-World Complexity
Use AI to generate a dataset that fits your business case.
Don’t just list metrics—define their distributions, segment types, and time granularity.
Include:
- Customer ID, sessions, purchases
- Timestamped events
- Campaign attribution
- Numeric + categorical fields (e.g. CLV, product category, cohort)
Add intentional noise or anomalies for realism.
Prompt example:
“Create a 30,000-row synthetic dataset for the [use case]. Include fields like [CLV, session count, conversion rate, product type, campaign source]. Vary distributions realistically.”
Step 10: Build, Analyze, Ship – Your First End-To-End Bi Simulation
Final step: build the dashboard. This is your real-world simulation.
You’ve already defined the problem, mapped the metrics, created the visuals, and generated data.
Now execute.
Deliverables:
- Decision-focused dashboard
- Problem-solution narrative (written or presented)
- KPI layer + insights summary
- Optionally: a 3–5 slide “executive readout” deck
Conclusion:
This isn’t just another way to learn dashboards. It’s a system for thinking like a strategist, backed by AI, driven by business logic, and grounded in real world scenarios. By the end of this process, you’ll know how to break down any industry and speak its operational language, spot real business problems, not just data anomalies, identify the metrics that matter and know what they mean. Design dashboards that actually influence decisions. Build entire case studies, end to end without waiting for a manager or mentor tour. You don’t just learn how to use a tool. You learn how to think, ask better questions, and show up like a consultant. Why this matters, technical skills are replaceable. Strategic thinking isn’t. LLMs can explain a formula, but they can’t teach you how to frame a problem, align with business goals, and deliver insights that lead to action, unless you prompt them like a strategist. This methodology gives you that edge in a world where AI can build faster than ever, your value comes from clarity. Knowing what to solve, knowing how to think through complexity, and knowing how to turn insight into action. This is how you make the leap from analysts to trusted partners.