
Crypto Volume: How to Read It Without Fooling Yourself


By Jack Long
Most people look at crypto volume the way they look at a car’s speedometer. The number goes up, something exciting is happening. The number goes down, the market is asleep. That reading isn’t wrong, exactly, but it skips over almost everything that makes the figure useful. A single 24-hour total hides at least three separate questions: where the trading happened, what kind of trading it was, and whether it was real demand or just the same coins changing hands in a loop.
I’ve spent a fair amount of time staring at these numbers, mostly because I kept getting them wrong. What follows is the short version of what I wish someone had told me earlier.
Why crypto volume is harder to measure than it looks
In a stock market there is a consolidated tape. Trades get reported, and everyone more or less agrees on what traded that day. Crypto has nothing like that. Hundreds of venues run their own order books, publish their own feeds, and define “a day” in their own way. Some report in the coin’s own units, others in dollars, others in a stablecoin that is close to a dollar but not quite.
So any figure you see is a construction. Someone pulled feeds from a chosen set of exchanges, converted everything into one currency, lined up the time windows, threw out data they didn’t trust, and added up the rest. Change any of those choices and the total changes too. That is why two websites can show different numbers for the same day and both be acting in good faith.
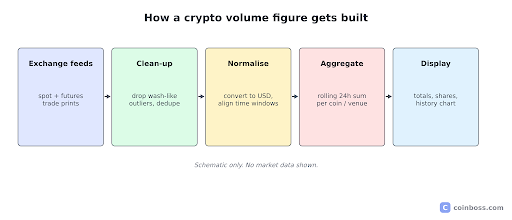
How a crypto volume figure gets built, step by step. Schematic only, no market data.
The practical lesson: pick one source with a clear method and stick to it. Comparing Monday’s reading from one site with Tuesday’s number from another tells you more about the two sites than about the market.
Spot and futures are two different animals
The biggest split in market activity is between spot and derivatives. Spot trading means someone actually buys or sells the coin. Futures and perpetual swaps are contracts that track the price, usually traded with leverage, and they routinely do more business than spot on a normal day.
That matters because the two kinds of activity mean different things. Heavy spot buying tends to reflect people taking ownership of an asset. Heavy futures activity can mean almost anything: hedging, short-term speculation, market makers balancing their books, or traders getting forced out of positions. If a headline says “volume doubled,” the first thing worth asking is which half of the market did the doubling.
This is where a decent crypto volume tracker earns its keep. The one I check is the CoinBoss page for crypto volume, which shows 24-hour futures and spot totals side by side, a per-coin breakdown, each exchange’s share, and a historical chart you can flip between futures and spot. When I captured it on the morning of 12 November 2026, futures sat at $166.69B for 24 hours against $111.25B for spot. Those figures move constantly, so treat them as a snapshot, not a benchmark.
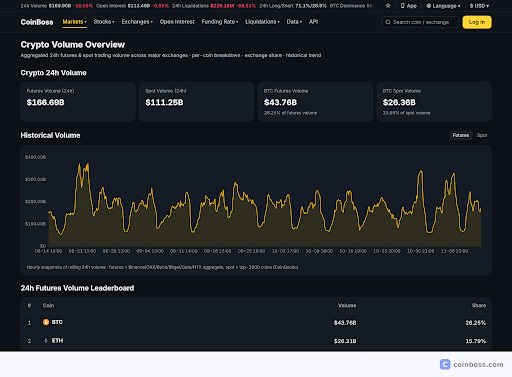
The CoinBoss Crypto Volume Overview page, captured 12 Nov 2026 at 10:26 (UTC+8). Figures are live and will have changed.
Bitcoin volume as a reference point
Bitcoin volume deserves its own look because it acts as the market’s anchor. When bitcoin volume climbs while the rest of the market stays flat, money is usually crowding into the largest, most liquid asset, which often happens when people get nervous. When altcoins grab a growing share of total activity, appetite for risk is usually rising.
You can see this by comparing the bitcoin share with the total rather than watching either number alone. A share that drifts for several days is worth more attention than a one-off spike. Some days a single coin outside the top ten briefly takes a big slice of futures activity because of a listing or a piece of news; that is worth knowing about, but it rarely says much about the broader market.
One more habit that helps: look at bitcoin volume on spot and on futures separately. If futures activity in bitcoin jumps and spot barely moves, the action is mostly leveraged positioning. If both rise together, more people are actually buying or selling the coin itself.
What a crypto volume tracker can and cannot tell you
A crypto volume tracker is good at answering “how busy is the market compared with last week?” It is not good at answering “is the price about to go up?” Volume describes activity, not direction. A heavy sell-off and a strong rally can both produce the same huge bar on a chart.
There are also known distortions. Some smaller exchanges have historically inflated their figures, and zero-fee promotions can produce bursts of trading that look like demand but aren’t. That is part of why well-built trackers limit themselves to major venues for derivatives and use a clearly named data source for spot. When you look at any chart, read the small print under it. It usually tells you exactly which venues are included.
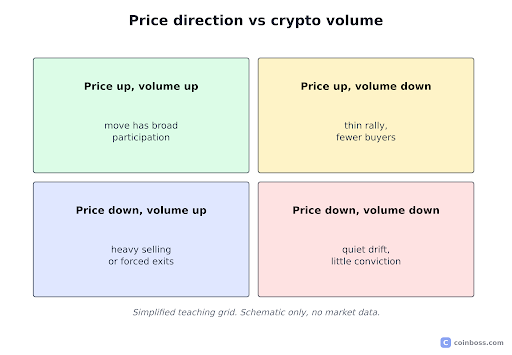
Price direction set against trading activity. Conceptual diagram only, no market data.
A short routine for reading crypto volume
Here is the routine I’ve settled on. None of it is clever, but it keeps me honest.
- Check the window. Is the figure a rolling 24 hours or a calendar day in a specific time zone? The difference matters around big news.
- Split spot from futures. Decide which story you’re looking at before drawing conclusions.
- Compare against the recent range. A number only means something next to its own history. The historical chart on a crypto volume tracker matters more than the headline total.
- Look at the leaders. Which coins and which exchanges are carrying the activity? If one venue accounts for an unusual share, find out why.
- Pair it with something else. Volume plus open interest, or volume plus funding rates, gives a much better picture than volume alone.
The engineering problem nobody sees
It’s easy to forget that every one of these dashboards is a small data-engineering project. Feeds go down. An exchange changes its API without warning. A token gets renamed and suddenly appears twice. Building a dataset that holds up over months means handling all of that quietly, usually with regular snapshots and checks that flag sudden jumps before they reach a chart.
For readers, the takeaway is simple. Trust a source that tells you how it builds its numbers and when it refreshes them. Be wary of one that only shows a big round figure with no explanation.
Closing thoughts
Crypto volume is one of the most useful numbers in this market, as long as you treat it as a description of activity rather than a forecast. Split it into spot and futures, keep an eye on bitcoin volume as a reference, use a crypto volume tracker with a visible method, and always compare today with the recent past. If you want a single place to start, CoinBoss puts volume next to open interest, funding and liquidations, which makes that kind of cross-checking a lot quicker.
Nothing here is investment advice; it’s a guide to reading data.







Comment