Procure analytics empowers procurement teams to turn vast amounts of data into strategic advantages, optimizing spend, mitigating risks, and boosting efficiency.
By focusing on data-driven procurement intelligence, organizations unlock deeper insights that transform operations from cost centers into value drivers.
This guide outlines 12 actionable strategies drawn from leading practices, helping procurement leaders implement high-impact improvements without delay.
Why Procure Analytics Drives Success
Procure analytics is the area in procurement that focuses on turning data into predictive and prescriptive insights.
By analyzing spend, supplier performance, and market data, organizations using advanced analytics often end up cutting double-digit money off budgets by identifying leakage and using data in negotiations.
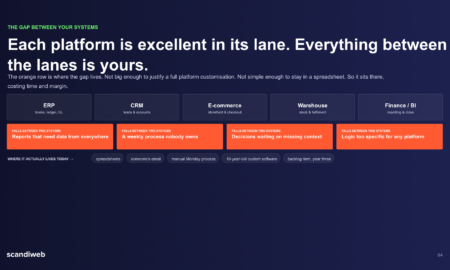
The new model starts with access to clean, centralized data sources to find opportunities.
Otherwise, procurement can only react, with no ability to support the business strategy, such as sustainability or agility.
Great teams treat analytics as a core competency, integrating it within their daily workflow to achieve better outcomes.
Strategy 1: Harness AI for Predictive Forecasting
AI improves procurement analytics through predicting demand, identifying supplier issues, and using machine learning models to predict price changes and delivery delays, often before such events actually happen.
Test models on categories with high spending and iterate for accuracy over time, while learning from real-time market signals for sharper predictions.
Multi-site planning cycles would leverage these forecasts.
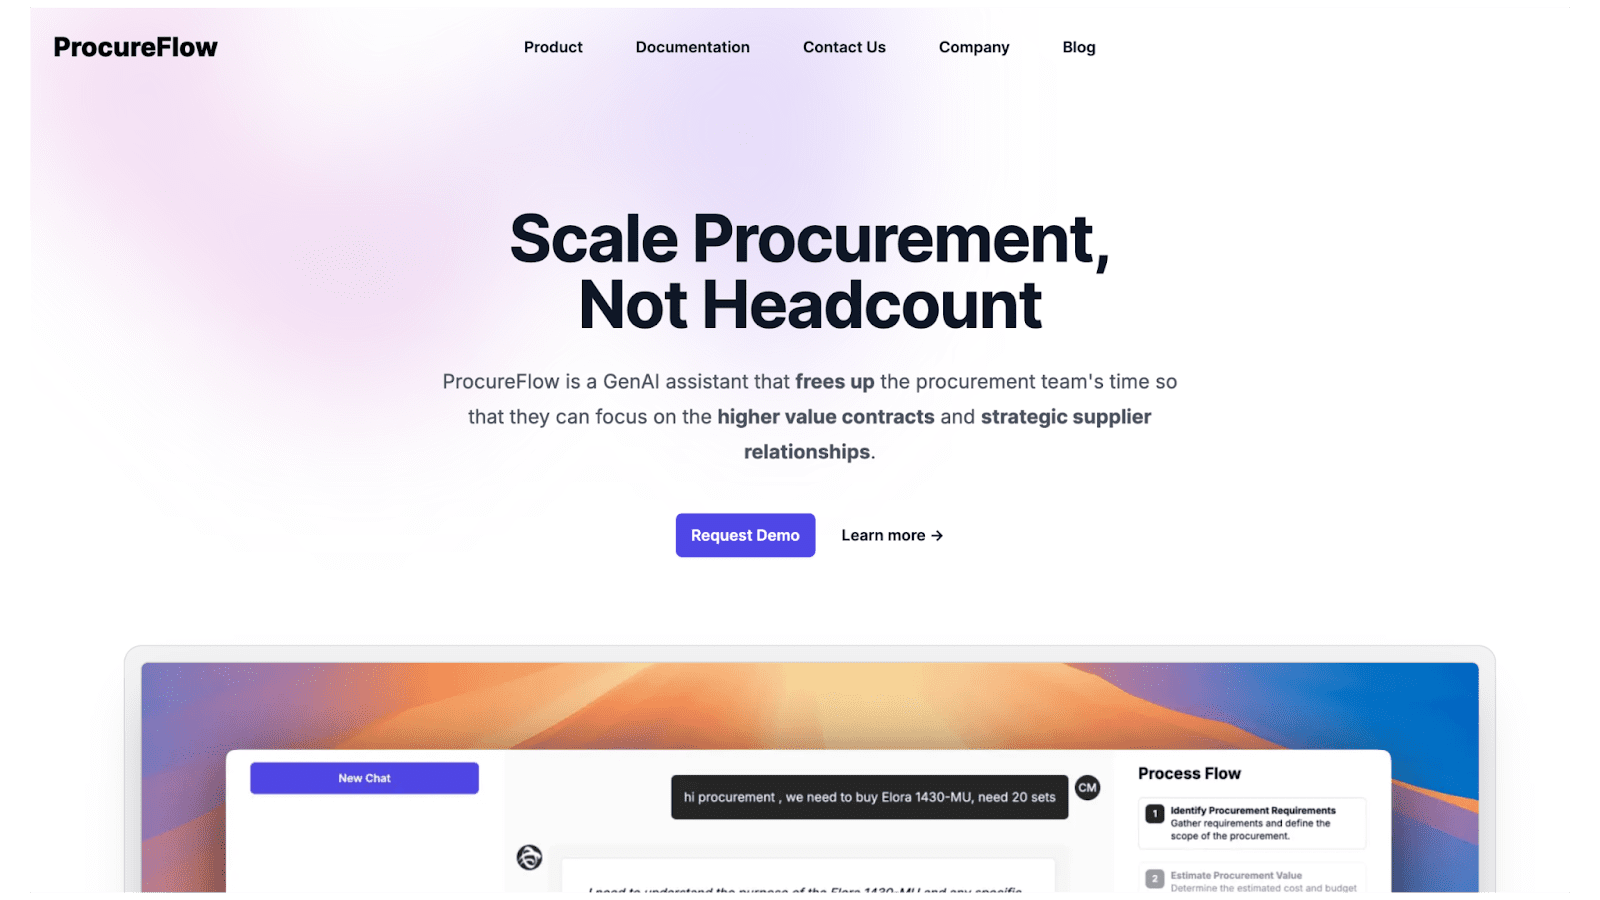
Procurement platforms like ProcureFlow use AI assistants, which simplify multi-site inventory optimization workflows.
Handling large amounts of data aids in managing sites spread across areas.
The result is fewer stockouts, overbuys, and emergency sourcing, allowing cash flow and operations to stabilize.
Anomaly detection early on signals sudden changes (e.g., sudden price increases by suppliers).
Smart feedback loops enable models to improve over time, ensuring forecasting can be an instrument for competition.
Strategy 2: Build Unified Spend Dashboards
Dashboards collate invoices, contracts, and purchase orders into interactive views, not disparate data.
High-level visualizations display cost per category and identify savings opportunities or compliance violations at a glance, and allow users to drill down into more detail.
Custom filters, such as those by department, region, or point in time, enable trend analysis.
Data is uploaded via multiple systems in real-time, eliminating manual matching and associated errors.
Leaders have visibility into maverick spend, underutilized contracts, and duplicate payments immediately.
These include advanced features like heat maps of high-risk areas and reports for executive presentations.
It allows decisions to be made faster and more informed throughout the organization and helps embed a data-driven culture.
Pair dashboards with mobile technology to ensure that field teams always have information to hand.
Strategy 3: Embed Risk Monitoring Everywhere
Risk analytics can match suppliers to global events and evaluate risk using various dimensions, i.e., single-sourcing and geopolitical risks.
Alerts automatically communicate risks within procurement workflows and approval processes.
Multi-factor indices consider financial stability, ESG factors, operational resilience, and cyber posture.
Strategize quarterly for supplier development, diversification, or exit based on scores, and quantify potential spend and timing impacts using risk scenarios.
Proactive actions minimize the costs of disruption, while risks become a source of resilience advantage.
Support monitoring of tier-2 and tier-3 suppliers, with built-in API integrations for external data feeds, to ensure complete supply chain visibility and resilience, and to meet compliance requirements.
Strategy 4: Automate Category Strategy Development
Using category management principles, cluster spend by category, identify tail spend purchases, consolidate suppliers into categories, and negotiate volume discounts to achieve 15-25% savings in indirect categories of spend.
Analytics can also identify subcategories with unrealized potential, highlighting potential consolidation opportunities.
Set rules for calculated purchases versus transactional buys.
Make approvals and re-order points automatic.
Consider dynamic pricing models when volume thresholds are exceeded.
Track return on investment and metrics to improve before and after implementation; adjust as necessary.
This scales expertise without additional headcount and lets your analysts focus on the trickiest negotiations.
Complement your data with market intelligence, used to benchmark against competitors and increase negotiating power.
Strategy 5: Prioritize Sustainability Through Data
Track ESG indicators like carbon footprint, ethical business behavior, and circular economy impact in your procurement analytics.
Score suppliers for sustainability to find greener alternatives to transport low-emission items or recycle components.
Lifecycle costing makes a comparison of initial purchase savings to future costs like disposal fees.
Key Steps for ESG Integration
- Assign scores based on verified supplier data and third-party certifications.
- Visualize progress in dashboards for stakeholder reporting, with trend lines over time.
- Benchmark against industry norms for continuous improvement and goal-setting.
Regular audits ensure score accuracy, while predictive tools forecast ESG-related cost shifts.
This positions procurement as a sustainability leader, meeting regulatory and reputational demands head-on.
Strategy 6: Create Dynamic Supplier Scorecards
Scorecards span delivery, quality, innovation, and responsiveness past basic KPIs.
They depend on category weights.
Speed has priority regarding MRO, and quality has priority regarding components.
Suppliers failing in meeting requirements may be given a corrective action plan to address performance issues.
Monthly cross-portals and joint review sessions generate additional feedback loops around the scores.
Preferred suppliers with priority, rapid payment, or co-innovation opportunities have lower total ownership costs.
Analytics identifies partnership opportunities like joint research and development (R&D) of differentiated products.
Stronger relationships create reliability, flexibility, and competitiveness in rapidly changing markets.
Encourage self-assessments from suppliers, mediate conflicting reports, and ease long-term partnerships through structured dialogues for shared value creation and growth.
Strategy 7: Master Scenario-Based Planning
What if scenarios in analytics explore tariff changes, material shortages, demand spikes, currency rate changes, labor disruptions, and risk mitigation (alternate sources, price insurance, and financial hedges).
These models typically align with enterprise forecasting for use in cross-functional planning.
Building Effective Models
- Use historical data as baselines, augmented with external trend data.
- Run stress tests regularly, sharing outputs with finance and operations.
- Incorporate probabilistic outcomes for realistic range-bound forecasts.
This foresight minimizes reactive spending, builds buffer stocks strategically, and enhances agility against uncertainties.
Strategy 8: Eliminate Maverick Spend
Find off-contract purchases (20-30% of spend) with analytics, looking for buyers, categories, or departments, as well as overall spend.
Think about mandatory catalogs, training, or exception reporting.
Catalogs that are easy to use and automated approvals aid compliance, and gamified incentives may motivate great adherence.
Implementation Tactics
- Visualize leakage hotspots with interactive maps and Pareto charts.
- Conduct post-intervention audits and coaching sessions.
- Measure reductions quarterly, tied to performance bonuses.
Direct savings follow, freeing budget for strategic initiatives while improving process discipline.
Strategy 9: Foster Cross-Functional Collaboration
Give analytics platforms to finance, operations, and legal.
Define joint KPIs like total cost of ownership or working capital efficiency.
Role-based access controls in federated governance ensure data accuracy.
It does not create bottlenecks.
When people frequently share insights, they can identify opportunities for bundled sourcing processes, and enterprise views improve agility when they provide up-to-date information about capex projects.
Collaborative forecasting reduces variances and speeds time toward value.
Promote cross-team working groups to address the priority.
Rotate the members to encourage new voices.
Strategy 10: Invest in Team Upskilling
Train on data visualization, AI tools, predictive modeling, and storytelling with insights within.
Hands-on workshops improve dashboard creation skills, build scenarios with predictions, hunt for anomalies, and build confidence within attendees.
Establish analytics champions to promote, mentor, and pilot analytics initiatives.
Training Roadmap
- Start with the basics for all staff, progressing to advanced certifications.
- Use real datasets for practical exercises.
- Rotate roles for knowledge sharing and empathy-building.
Empowered teams unlock 2-3 times more value from existing tools, innovating new use cases independently.
Strategy 11: Quantify Every Initiative’s ROI
Track the ROI of each track: saved costs, cycle time, avoided risks, and intangible benefits, like agility. Before every release, set a baseline for the track and use control groups when possible.
Tiered metrics include savings, predictive accuracy, and system adoption rates over time.
Executive dashboards show procurement as a profit center, allowing drill-through to supporting data.
Measurement-based focus enables sustainable investment, recognition of underperformers, and strategy iteration.
Strategy 12: Ensure Data Quality Foundations
Analytics depends on data quality.
Validate, deduplicate, and standardize. Audit your ERP, POs, and invoices on a regular basis to catch discrepancies early.
Governance policies own and prepare automated pipelines for periodic cleaning.
High-quality inputs multiply the benefits of all of the above strategies across the organization.
Adopt master data management for supplier and item information management.
Monitor quality KPIs (for completeness, timeliness) to maintain the trust of stakeholders.
Crafting Your Implementation Roadmap
Track the ROI of each track: saved costs, cycle time, avoided risks, and intangible benefits, like agility.
Before every release, set a baseline for the track and use control groups when possible.
Tiered metrics include savings, predictive accuracy, and system adoption rates over time.
Executive dashboards show procurement as a profit center, allowing drill-through to supporting data.
Measurement-based focus enables sustainable investment, recognition of underperformers, and strategy iteration.
Phased Rollout
- Phase 1: Assess and clean data (1-2 months).
- Phase 2: Deploy dashboards and AI pilots (3-6 months).
- Phase 3: Full integration and optimization.
Expect measurable gains in efficiency and savings within quarters.
For authoritative benchmarks, consult procurement research organizations like CAPS Research.