In the financial technology sector, data is more than just information—it’s the bedrock of every transaction, risk assessment, and compliance check. As the complexity of financial instruments and regulatory frameworks grows, so does the challenge of managing the web of interconnected data. Traditional spreadsheets and reports often fail to capture the dynamic, multi-layered nature of financial systems, leaving institutions exposed to unseen risks and operational inefficiencies.
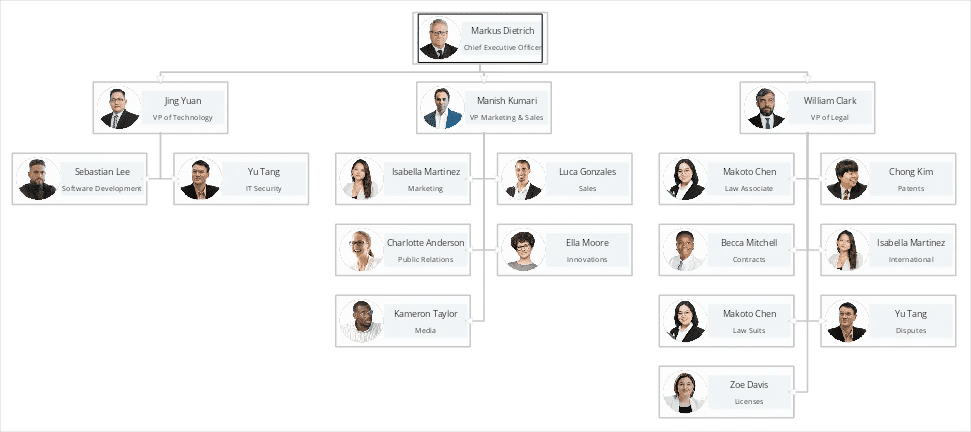
The core of the problem lies in visualization. How can a compliance officer trace the flow of funds through multiple jurisdictions? How can a risk analyst model the cascading impact of a single market event on a diverse portfolio? Answering these questions requires more than just numbers in a grid; it demands a clear, interactive visual representation of relationships and dependencies. This is where modern data visualization tools become mission-critical infrastructure.
The Limitations of Traditional Approaches
For years, FinTech development teams have faced a difficult choice: build a custom visualization solution from scratch or rely on generic, often inadequate tools. Building in-house is a massive undertaking, diverting expert developers from core business logic to the complex, specialized domain of graphics programming. This path is fraught with challenges, from ensuring high performance with large datasets to securing the application against supply-chain vulnerabilities hidden in open-source dependencies. The result is often a solution that is expensive, late, and difficult to maintain.
Generic tools, on the other hand, often lack the specific features required for financial modeling, such as auditable data trails, complex node types for representing financial instruments, or the performance to handle real-time data streams.
A New Paradigm: Enterprise-Grade Visual Component Libraries
The most effective modern solution is to leverage a dedicated, commercially-supported component library designed for building complex visual interfaces. By integrating a specialized tool, development teams can bypass the long and risky development cycle and focus on what they do best: building innovative financial products.
An enterprise-grade diagramming library provides the essential building blocks for FinTech applications. For example, developers can build interactive dashboards that model transaction flows, allowing auditors to visually trace the path of assets and identify anomalies in real-time. Risk management teams can create dynamic graphs that represent counterparty risk, with nodes expanding to reveal underlying assets and connections.
The key is to choose a tool that is both powerful and secure. For applications handling sensitive financial data, a zero-dependency architecture is critical. The ideal solution is a library where every line of code is developed in-house, eliminating the risk of third-party vulnerabilities.
By adopting a robust visualization component, institutions can transform abstract data into clear, actionable insights. This not only enhances risk management and simplifies compliance but also empowers teams to innovate faster and more securely. For any FinTech firm looking to gain a competitive edge, investing in a professional visualization toolkit is no longer a luxury—it’s a necessity. To see how such tools can be applied, learning more about an established, secure, and feature-rich MindFusion’s JavaScript Diagram Library is a crucial first step for any development team in the financial sector.