Beyond the Surface: Unveiling the Layers of Market Depth
In the intricate dance of financial markets, price is merely the tip of the iceberg. Beneath the surface lies a complex network of buy and sell orders, representing the collective intentions of market participants. This underlying structure, known as market depth, provides crucial insights into potential price movements and areas of significant support or resistance. Understanding market depth allows traders to move beyond simply reacting to price changes and instead anticipate potential turning points based on the concentration of orders. By visualising this hidden landscape, traders can gain a significant edge, making more informed decisions and potentially improving their trading outcomes. The ability to “see the unseen” within the order book is a powerful tool in the modern trader’s arsenal.
The Trader’s Eye: Visualising Liquidity with Heatmaps
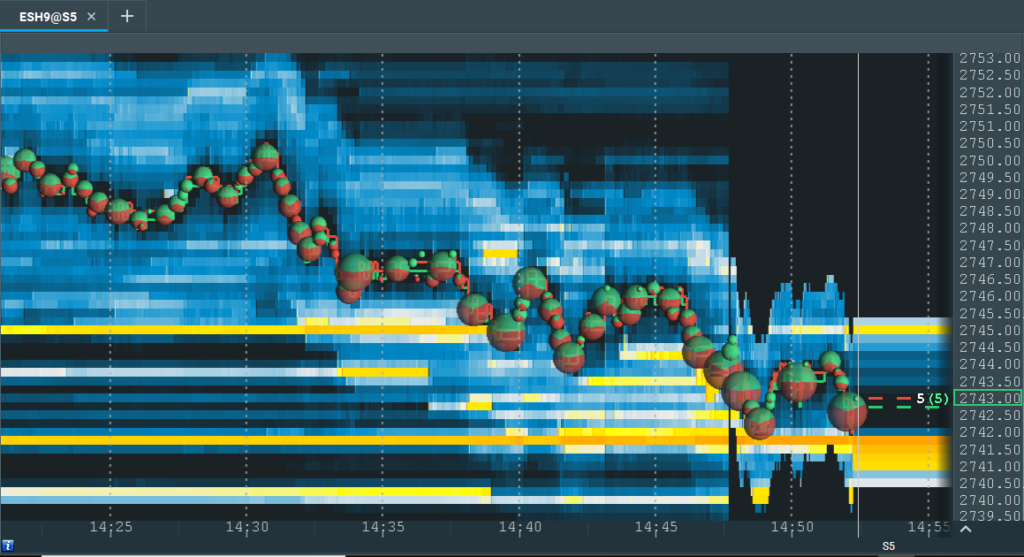
While raw order book data can be overwhelming and difficult to interpret quickly, heatmap visualisations offer a clear and intuitive way to understand market depth. A trading heatmap transforms the numerical data of the order book into a colour-coded representation, making it easy to identify areas of high and low liquidity at a glance. Imagine the order book as a vast ocean of buy and sell orders at various price levels. A heatmap acts like a sonar, highlighting the areas where the largest concentrations of these orders reside. For instance, a platform like Bookmap excels at providing this kind of dynamic, real-time visualisation. The intensity of the colour on the heatmap typically corresponds to the volume of orders at a particular price level. Brighter colours, such as reds and yellows, often indicate a large number of limit orders, suggesting potential areas of strong support or resistance. Conversely, darker or less intense colours may indicate thinner liquidity, where price might move more easily.
Decoding the Colours: Understanding What the Heatmap Tells You
The key to effectively using heatmaps lies in understanding the colour coding and what it represents in the context of market depth. While specific colour schemes can vary between trading platforms, the underlying principle remains consistent. Typically, warmer colours (red, orange, yellow) indicate a higher concentration of limit orders at those price levels. These levels can act as magnets for price, potentially causing reversals or slowdowns in momentum. Cooler colours (blue, green) generally signify lower levels of liquidity, suggesting that price might move through these areas more swiftly. White or very light colours might indicate the current best bid and ask prices. By observing the intensity and distribution of these colours, traders can quickly assess the overall liquidity profile of a particular asset at any given moment. This visual representation allows for faster and more intuitive decision-making compared to sifting through rows of numbers in a traditional order book.
Hunting for Hidden Orders: Identifying Significant Liquidity Zones
One of the most valuable applications of heatmaps is their ability to reveal hidden liquidity zones – areas where large orders are placed but not necessarily immediately visible in the standard order book. These “iceberg orders,” as they are sometimes called, are designed to be partially filled at a time, preventing the market from reacting too strongly to the presence of a large buyer or seller. Heatmaps can often expose these hidden orders through a persistent and intense colour at a particular price level, even as individual visible orders are filled. Identifying these significant liquidity zones can provide valuable insights into where large institutions or sophisticated traders are positioned, potentially indicating future price direction. Traders can use this information to anticipate potential reversals, breakouts, or areas where price might consolidate.
Putting it into Practice: Integrating Heatmap Insights into Trading Strategies
The insights gained from heatmap analysis can be integrated into various trading strategies. For example, a trader might look for clusters of strong buying liquidity on the heatmap near a key support level identified through technical analysis. This confluence of signals could provide a higher-confidence entry point for a long position. Conversely, a concentration of selling liquidity near a resistance level might suggest an opportune time to take profits or initiate a short position. Heatmaps can also be used to identify areas where stop-loss orders might be clustered, allowing traders to avoid placing their stops in easily targeted zones. Furthermore, observing the heatmap during periods of high volatility can provide clues about the strength of buying or selling pressure and potential exhaustion points.
Clarity in Complexity: The Advantages of Heatmaps Over Traditional Order Books
While the traditional order book provides the raw data of market depth, heatmaps offer several advantages in terms of clarity and ease of interpretation. The visual nature of heatmaps allows traders to quickly grasp the overall liquidity profile without having to constantly scan and interpret numerical data. This is particularly beneficial in fast-moving markets where split-second decisions are often required. Heatmaps can also highlight subtle shifts in liquidity that might be missed in the traditional order book view. The colour-coding makes it easy to identify significant order concentrations and potential iceberg orders, providing a more intuitive understanding of the forces at play. By simplifying the complex data of the order book, heatmaps empower traders to make faster and more informed decisions.
Navigating the Market’s Currents: Advanced Applications of Heatmap Analysis
Beyond identifying basic liquidity zones, experienced traders can use heatmaps for more advanced analysis. Observing the way the heatmap evolves in real-time can provide insights into the aggressiveness of buyers and sellers. For instance, rapidly intensifying colours on the bid side might indicate strong buying interest, while a sudden disappearance of liquidity at a certain price level could signal a potential move in the opposite direction. Traders can also look for divergences between price action and heatmap activity. For example, if the price is rising but the heatmap shows a weakening of buying liquidity, it might suggest that the upward move is losing momentum. These more nuanced interpretations require practice and experience but can provide a significant edge in understanding the subtle currents of market sentiment.
Avoiding the Mirage: Recognising and Interpreting False Signals
As with any trading tool, it’s important to remember that heatmaps are not infallible and can sometimes present false signals. A large cluster of limit orders on the heatmap might appear to be strong support or resistance, but these orders could be pulled or manipulated by sophisticated traders. It’s crucial to use heatmap analysis in conjunction with other forms of technical analysis and to consider the overall market context. Avoid relying solely on heatmap signals without confirmation from other indicators or price action patterns. Understanding the potential for manipulation and false signals is essential for using heatmaps effectively and avoiding costly trading errors.
The Trader’s Advantage: Gaining a Deeper Understanding of Market Microstructure
Ultimately, mastering the use of heatmaps provides traders with a significant advantage by allowing them to gain a deeper understanding of market microstructure. By visualising the hidden layers of liquidity and observing the real-time interaction of buy and sell orders, traders can move beyond simply reacting to price and instead anticipate potential movements based on the underlying forces of supply and demand. This enhanced understanding can lead to more confident and informed trading decisions, potentially improving profitability and overall trading performance. So, peer into the depths, decode the colours, and unlock the hidden insights that heatmaps reveal – your trading journey may never look the same again.