Everybody knows that proper Analytics metrics are essential on every type of website: from WordPress Blogs to e-commerce marketplaces. The recent removal of the active install growth chart by WordPress due to “insufficient data obfuscation” (What? Yes!) without any public discussion, inflames a dialog about what business owners should do and how to act without so much needed data.
What metrics matter most?
Winston Burton from Search Engine Journal suggested the top 17 essential metrics for the business, the main ones would be Traffic, Conversions, Bounce Rate, Landing Page metrics (including page speed and exit pages), new vs. retained customers, and ROI. Spotting hackers and security breaches are crucial. Last, but not least, a Funnel map that analyzes every stage. To do this, you will need a quality analytics tool that works with WordPress, too.
- Traffic
It’s one of the most vital metrics to monitor. Organic traffic is good and leads to purchases. According to Digital Information World, hackers compromise 15,000 sites through a massive hacking campaign that uses SEO to redirect traffic from compromised sites to discussion forums that are entirely illegitimate. Traffic diagrams can reveal the beginning and end of click fraud sessions. Analytical systems can identify different types of bad traffic by comparing them to formal metrics through the analysis of operating systems, browsers, IP addresses, screen resolution, and others.
To increase the number of unique visitors, you need to increase the amount of traffic to the web resource by connecting contextual and targeted advertising on the site, SEO – search engine optimization.
- Conversions
SEO and advertising are about the conversion of qualified traffic into customers. If conversions are increasing, it means the promotion strategy is working and, as a result, sales, leads, or downloads are increasing. Consider it a success!
Absolutely all elements of the site work for conversion. If the conversion rate is low, you need to analyze user behavior and work on the usability and design of the site, location, and content of conversion elements.
- Landing Page Metrics
Track organic sessions and other conversion metrics to see how the pages on your site are doing over time, what pages perform well, and any gaps and opportunities.
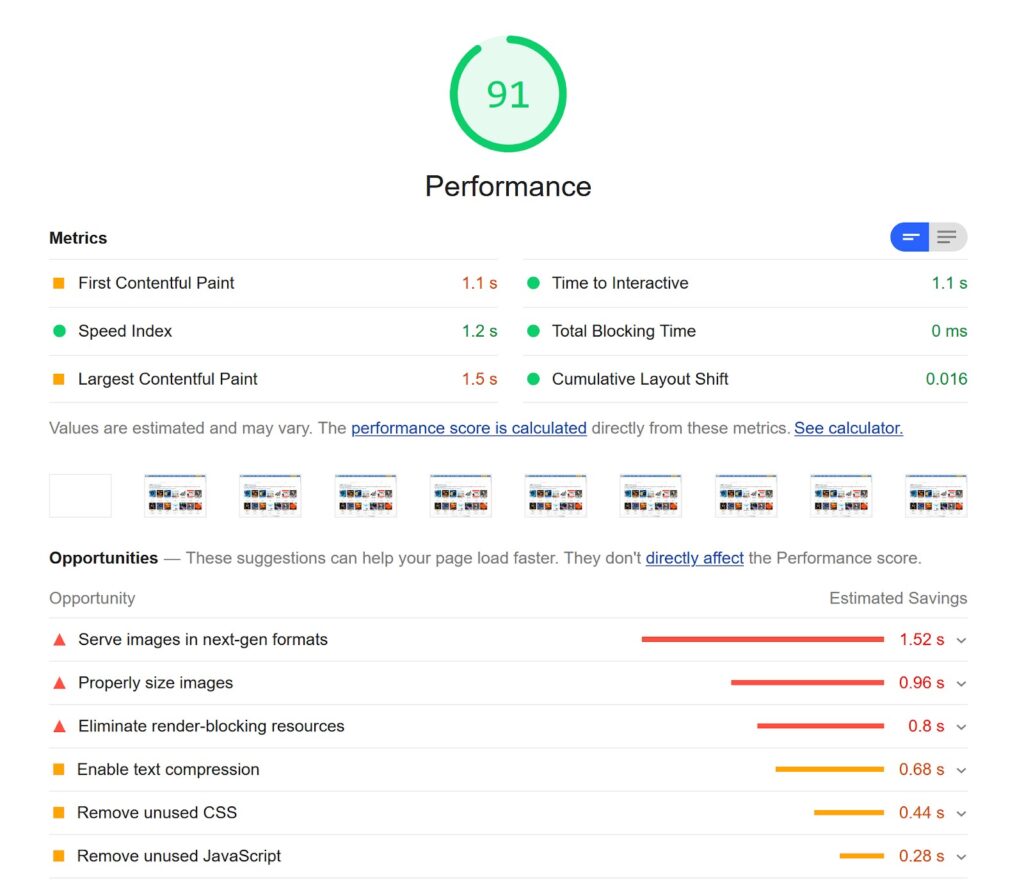
The time it takes to fully load a particular page of a web resource. Loading speed is one of the main site metrics for search engines. It is calculated with the help of counters of web analytics systems, with the help of special services for increasing the efficiency of SEO promotion. To increase the loading speed of the site, you need to optimize the loading of images, clean up the site code, move scripts and style sheets to other files, and not get carried away with a large number of heavy-moving elements on the site. You can see these parameters on a screenshot from the Finteza report.
To increase the number of new visitors, you need to work with the amount of traffic to the site or its quality. Contextual and targeting advertising will also help, as well as SEO promotion – quality internal and external optimization of the site in order to increase the site’s position in search engines. The higher a website is in a search engine, the more new visitors it will attract. To increase time on the site, post content that is relevant to your audience and provide a user-friendly interface with extensive linking.
- New vs. Retained Customer
Visitors who come to your site for the first time are new. To decrease the time between the first visit and the next, you need to constantly work with visitors, set up targeting, and connect email marketing.
The Retention rate helps evaluate the results of marketing promotions and technical changes in your projects. In a timely notice, changes in user behavior, negative and positive, can help with effective spending of your advertising budget or site optimization. If you have many returning visitors, and low conversions, revisit your exit pages to see what’s preventing people from making a purchase.
To visit repeatedly, you need to maintain user interest in the site, regularly update published materials, and report interesting information (about discounts and promotions, for example). If you have an informational resource, keep regular columns, and give more fresh news. This should be interesting to read and re-read content, coming back to it again and again.
- Bounce Rate
The percentage of users who visited a page for 15 seconds or less compared to the total number of users who visited your site.
The lower the bounce rate, the better the site. A high percentage of bounces can indicate poor design or an uncomfortable website, as well as poor quality traffic and targeted visits.
- Sales Funnel
If you constantly monitor conversions, you eventually see that the list of funnels has become too lengthy and inefficient. It means the funnel is too complex, and some stages should be removed to reduce complexity.
Non-converting leads are a big problem. An accurate analysis of weak spots helps to gain information on why you might be losing clients. By reducing these weaknesses, the client base will quickly grow. Insights could be such as what clients are doing across your websites. Customer experience is important. “Essentially, customers are more likely to return to your business if they feel like their needs are understood and expectations are met. This includes listening to customer feedback and implementing changes.” – says Corey Patterson on MarcTech.
The quality of traffic reveals visitors who use HTTP proxies, VPNs, or TOR networks. The connection methods are often used by suspicious visitors. That category usually shows lower conversion rates. Bad traffic from bots with no conversion and low-quality traffic can lower your visibility in the Search Engines. You can see the Traffic Quality report in the screenshot:
Customers could attract more and spend more on additional products or services (in addition to what they have already purchased). It would also increase the average bill.
- ROI
The formula is simple:
ROI = (Organic Traffic * Conversion Rate * Avg Order Value) / Cost of SEO
First, you’re creating the Sales Funnel. Second, setting special conditions for sales such as geographical location, applications, devices, ad formats, etc. Finteza presents efficient graphic visualization with different colors of conversion rates and percentages showing values above the average in green, and below the average in red. Last, adding advertising campaigns you need to analyze. And in a matter of seconds, you have the Return on Investment value. To lower your ROI price, you need to show ads to your target audience. You need to actively optimize your site.
Conclusion
The good analysis is conducted simultaneously in several directions, and the data is compared on individual pages and site averages. Portal analysis tools help you work to improve your site and make adjustments to your marketing strategies. You can read more about the basics of marketing analytics on MarTech.
Tracking website metrics is necessary to make really accurate conclusions about the effectiveness of contextual and targeted advertising, SEO promotion, and the web resource itself. In addition to constantly checking the data, it is worth comparing metrics for different reporting periods in order to note the dynamics of growth or decline in indicators and work to improve them.