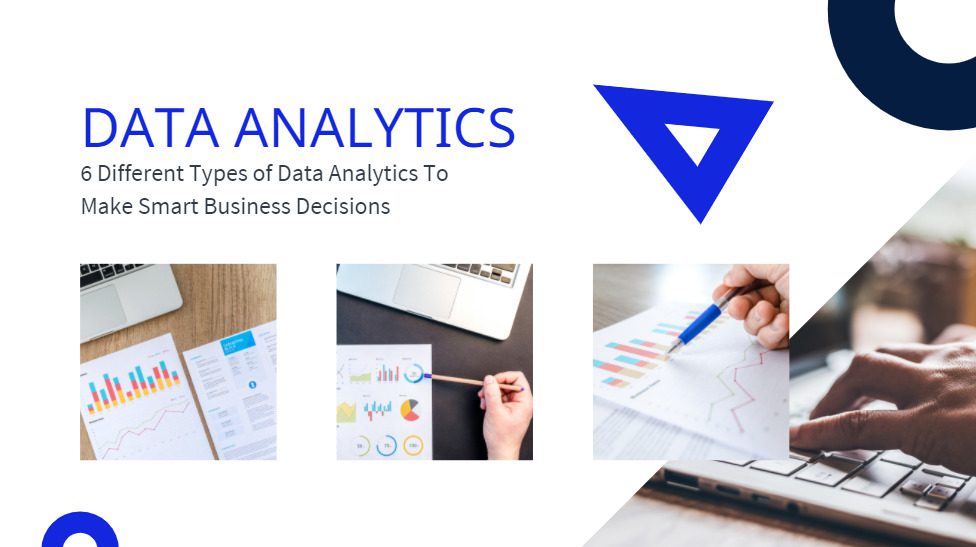
Business intelligence refers to the data a company collects that can be applied to strategic business decisions. Six different types of data can be used to make smarter business decisions and build a successful sales funnel. Let’s take a look at them.
1) Manufacturing Analytics
Manufacturing analytics help summarize the production progress and help determine the total working hours and associated expenses. It enables you to identify the rate of production, equipment failures, poor quality control, or bottlenecks that could be slowing down production. Both AI and ML help in industrial process optimization. To get a complete picture of the entire manufacturing cycle, an analytics dashboard must merge all the data sources.
The critical manufacturing analytics metrics to measure are:
- Production volume
- Production costs
- Throughput
- Overall equipment effectiveness (OEE)
- Productivity in revenue per employee
- Overall operations effectiveness (OOE)
- Cash-to-cash cycle time
- EBITDA (Earnings before interest, taxes, depreciation, and Amortization)
Tools such as Productoo and MachineMetrics lets you capture manufacturing insights to data-driven insights.
2 ) Sales Data
The sales data lets you have a deeper understanding of the most liked products by the customers and uncovers the reason why the customers want to buy. Data’s impact on traditional lead generation is immense. Sales analytics aids in better decision making and improves the overall performance of the sales team.
The significant sales metrics that revenue leaders should track are:
- Annual recurring revenue
- Average profit per user
- Average deal size
- Conversion rate
- Sell-through rate
- Cannibalization rate
- Sales per rep
- Sales by region
Sisense is one of the world’s leading sales analytics platforms that utilize AI-driven analytics to skyrocket your sales.
3) Help Desk Analytics
Help desk analytics is a crucial part of the overall customer experience management. Help desk dashboards let you visualize your support team’s performance and drive actionable insights to improve customer retention and reduce churn rates.
Here are the essential components of the sales analytics dashboard:
- Total tickets
- Tickets resolved
- Maximum time to resolution
- Minimum time to resolution
- Average resolution time
- Average first reply time
- Ticket priority
- Satisfaction rate
The help desk analytics easily integrates with other data sources for cross-functional analysis. Pre-built reports and dashboards assist in elevating your support team’s performance. Zendesk is a powerful help desk software that takes customer issues from multiple sources and transforms them into tickets.
4) Marketing Metrics
Marketing metrics lets you identify the campaigns or touchpoints that resonate more with customers. Marketing analytics consists of different KPIs that are tracked by marketing teams to understand the buyer journey and optimise campaigns’ effectiveness across all the marketing channels. Some of the valuable marketing metrics are:
- Marketing Qualified Leads
- Sales Accepted Leads
- Return on Investment (ROI
- Customer Lifetime Value (CLV)
- Cost Per Customer Acquisition (CPA)
- Customer Retention Rate
Different marketing metrics help to maintain a regular flow of leads to generate more conversions.
There are several tools such as HubSpot that offer a robust marketing analytics suite to measure and optimize all your campaigns using a single dashboard.
5) Social Media Metrics
Social media metrics are vital to understanding the importance of the brand in the eyes of the customers. Facebook pixels and Google Analytics UTM parameters help you to measure the performance of the social media marketing team.
Besides, social listening analysis allows you to find the customer sentiments towards your brand.
Moreover, you can track your competitors and find out the steps they are taking to improve their social reputation. Tracking reviews and brand mentions across social networks is vital to enhance the reputation of the business.
For instance, YouTube analytics offers different metrics to analyze and create better videos. As Invideo suggests in this post, YouTube metrics can be used to create content that resonates with your audience’s needs.
The different social media metrics that matter for every brand are:
- Social share of voice
- Applause rate
- Average engagement rate
- Social media referrals
- Conversion rate
- Cost per conversion
- Positive and negative brand sentiments
Hootsuite and Mention let you pinpoint meaningful conversations and manage how the customers perceive your brand.
6) Financial Data
Financial analysis is done before product launches or planning any go-to marketing strategies. The idea is to analyze whether the product or the strategy is profitable enough in the long run. Several different types of financial analysis such as vertical, horizontal, liquidity, efficiency, growth, profitability, and cash flow are done to analyze current profitability and risk.
The essential financial metrics every manager should track are:
- Gross profit margin
- Net profit margin
- Working capital inventory turnover
- Berry ratio
- Economic value added
- Pricing policy
- Pricing index
- Transactions error rate
- Excess cash
Fintibi is a financial analysis software for preparing financial statements, analyzing financial ratios, or performing variance analysis.
Final Thoughts
Business analytics uses various statistical analysis methods to identify past business trends, current business performance and predict future business profitability. Businesses should use different analytics software to optimize the performance of their marketing, sales, and customer support teams. Moreover, the C-suite management can take data-driven decisions leading to improved profitability. Companies that use business analytics are smarter and stay in the market for years to come.