
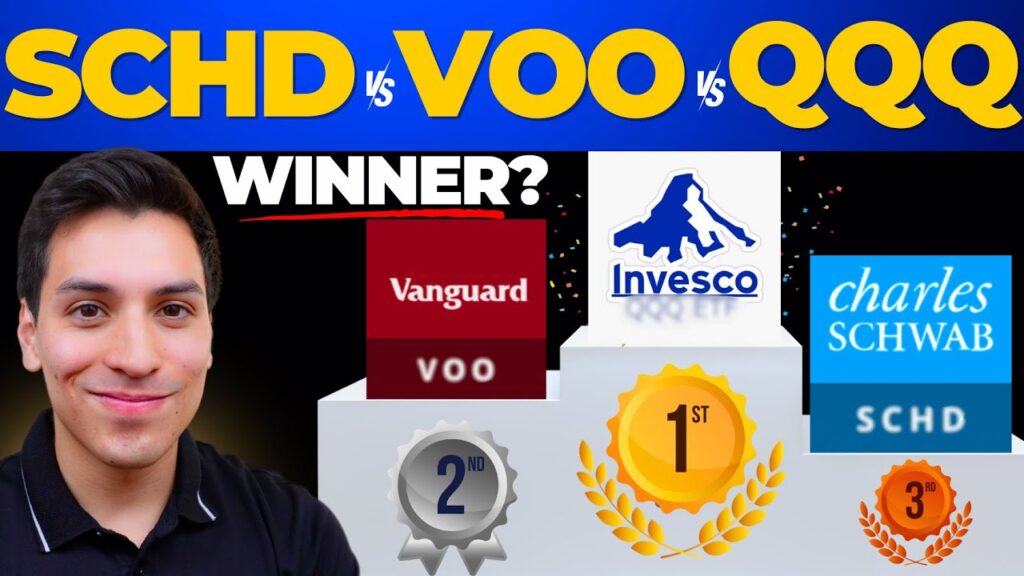
As 2025 unfolds with Fed rate cuts fueling market optimism, low-cost index funds and ETFs remain the gold standard for long-term investors seeking diversification, low fees, and reliable growth. Among the most popular choices—Vanguard S&P 500 ETF (VOO), Vanguard Total Stock Market ETF (VTI), Invesco QQQ Trust (QQQ), and Schwab U.S. Dividend Equity ETF (SCHD)—the debate rages: Which delivers the best balance of returns, risk, and income? Based on historical data through late 2025, forward projections, and expert analyses, this comparison breaks down their performance, holdings, and suitability. Spoiler: There’s no single “winner”—it depends on your goals—but we’ll crown a versatile champ for most portfolios.
Quick Overview of Each ETF
- VOO (Vanguard S&P 500 ETF): Tracks the S&P 500, focusing on 500 large-cap U.S. stocks. Ideal for core exposure to America’s biggest companies. AUM: ~$1.2 trillion. Expense Ratio: 0.03%.
- VTI (Vanguard Total Stock Market ETF): Covers ~3,700 U.S. stocks across large-, mid-, and small-caps for broadest market representation. AUM: ~$1.6 trillion. Expense Ratio: 0.03%.
- QQQ (Invesco QQQ Trust): Mirrors the Nasdaq-100, heavily tilted toward tech and growth stocks (e.g., Apple, Microsoft, Nvidia). AUM: ~$321 billion. Expense Ratio: 0.20%.
- SCHD (Schwab U.S. Dividend Equity ETF): Selects ~100 high-quality dividend payers with strong fundamentals. AUM: ~$60 billion. Expense Ratio: 0.06%.
All four boast rock-bottom fees compared to the ETF average (0.44%), making them efficient for buy-and-hold strategies in 2025’s volatile yet upward-trending market.
Performance Comparison: Past, Present, and Projected
Historical returns highlight QQQ’s growth edge, but VOO and VTI offer steadier paths, while SCHD shines in income and downturns. Data as of Q3 2025:
| Metric | VOO (S&P 500) | VTI (Total Market) | QQQ (Nasdaq-100) | SCHD (Dividend) |
| 1-Year Return (2024-25) | 24.5% | 23.8% | 28.1% | 12.4% |
| 5-Year Annualized | 15.2% | 14.8% | 20.0% | 11.1% |
| 10-Year Annualized | 13.1% | 12.5% | 18.3% | 11.0% |
| YTD 2025 Return | 18.2% | 17.5% | 22.4% | 8.9% |
| Dividend Yield | 1.3% | 1.4% | 0.6% | 3.5% |
| Max Drawdown (2022) | -24.5% | -25.1% | -33.2% | -15.8% |
| Projected 2025 Return | 10-12% | 9-11% | 12-15% | 8-10% |
Sources: ETF provider data and Morningstar through Q3 2025. Projections assume 2-3% GDP growth, continued easing, and no major recession.
QQQ’s tech dominance drove superior returns (18.3% over 10 years), outpacing VOO by ~5% annually, but with steeper volatility—its 2022 drawdown was 33% vs. VOO’s 25%. VTI adds mid/small-cap exposure for slight diversification, but trails VOO marginally due to higher volatility from smaller firms. SCHD lags in total returns but crushes on income (3.5% yield) and resilience, performing best in recessions with only 16% drawdown in 2022.
For 2025, analysts project QQQ leading (12-15%) on AI/tech tailwinds, followed by VOO/VTI (9-12%) amid broad recovery, and SCHD (8-10%) for steady dividends in uncertain times.
Risk and Volatility: Stability vs. Growth
- VOO: Low volatility (beta ~1.0), broad sector mix (30% tech, 13% financials). Best for balanced growth with minimal tracking error.
- VTI: Slightly higher risk (beta 1.02) from small-caps, but ultimate diversification—holds 3,700+ stocks vs. VOO’s 500.
- QQQ: High volatility (beta 1.15), 50%+ in tech—thrives in bull markets but crashes harder (e.g., 33% drop in 2022).
- SCHD: Lowest risk (beta 0.85), focuses on quality dividend payers (e.g., Coca-Cola, Home Depot). Overlap with VOO is <10%, adding value tilt.
In 2025’s post-cut environment, QQQ’s concentration risks rise if AI hype fades, while SCHD’s defensiveness appeals amid election/tariff uncertainties.
Who Should Choose Which?
- VOO: Core holding for most (e.g., 401(k)s). Suits moderate-risk investors wanting S&P 500 purity. “Set-it-and-forget-it” staple.
- VTI: Beginners or diversification seekers. Perfect if you believe small/mid-caps rebound in easing cycles (projected 10%+ upside).
- QQQ: Aggressive growth chasers (under 40s). Ideal for tech bulls, but pair with bonds to tame swings.
- SCHD: Income-focused or retirees. Great complement to growth ETFs—boosts yields without sacrificing much return.
Reddit consensus: Core with VOO/VTI, tilt to QQQ for growth, SCHD for stability. A 40/30/20/10 split (VOO/VTI/QQQ/SCHD) balances all worlds.
The 2025 Outlook: No Clear Winner, But a Portfolio Strategy Emerges
Projections favor QQQ for highest returns (18%+ potential in bull scenarios), but VOO edges as the “actual winner” for most—balancing 13% long-term gains, low costs, and moderate risk. VTI wins for pure diversification, SCHD for income/resilience. In a year of 10-12% market upside amid volatility, blend them: 50% VOO (core), 20% VTI (breadth), 15% QQQ (growth), 15% SCHD (income).
Track your mix with tradebb—it imports holdings, benchmarks performance, and alerts on rebalances to keep your portfolio optimized. Ultimately, the “best” ETF is the one you stick with—dollar-cost average into a diversified basket and let compounding do the rest in 2025’s favorable environment.