

In analytics, there is a lot of data to process. Data visualization tools help businesses bridge this gap by enabling users to see patterns in data. These patterns are further leveraged to make data-driven decisions. However, the presence of quintillion bytes of data makes it hard to interpret. Data visualization techniques solve this issue by displaying data in a way that makes it easier to understand.
Data Visualization helps you access insights that may be missed in a tabular report. A data visualization dashboard can help you better understand your business performance. Any and every organization can significantly benefit from visualizing its data.
What is Data Visualization?
Data visualization is using data to present information in a way that people can understand without effort. Data visualization can be utilized to communicate a wide range of information, from simple bar graphs and pie charts to complex 3D models and animations.
Simple as it may sound, converting data into an infographic can be difficult. Effective data visualization requires a subtle art of storytelling. In addition, each visualization type has its advantages. For example, pie charts can be very informative, while line graphs are good for showing long-term trends.
Why is Data Visualization Important?
-
Analyzes data
Data visualization is all about taking data and representing it in a way that is easy to understand. There are different ways of visualizing data, but it typically involves using charts, graphs, and other visual aids.
Data visualization in business analytics is important because it helps us see patterns, trends, and relationships that might not be obvious when looking at numbers.
Breaking them into digestible chunks can help us make sense of large amounts of data.
In addition to recognizing trends in large amounts of data, data visualization can help us compare things and differentiate between two groups or how a change in one variable affects another variable.
- Streamlines Communication
Data visualization can help you communicate with others who do not have the same expertise as yourself in data, statistics, or analysis. In addition, it allows you to share insights about your work in ways that make sense to others outside your sphere of work.
Data visualization can also help you and others read between the lines on what the data entails that you might not have noticed before and to understand the relationships between pieces of data.
Data visualization improves team knowledge-sharing, as visual cues effectively communicate concrete and abstract data.
How is Data Visualization used?
Here are some ways in which you can use data visualization:
- Perform trend analysis by spreading data over time to find patterns and understand seasonality. A line chart is the best way to visualize trends.
- Establish relationships between two or more variables and understand how one affects the other. For example, a Scatter plot can be used to find the correlation between variables.
- Analyze the contribution of one dimension to the performance of a metric. For example, a pie chart can find the contribution percentages.
The different types of Visualizations
- Column charts
They’re similar to bar graphs. They’re helpful when you want to display categorical data.
- Line charts
Line charts use lines to represent quantitative values. For example, how many miles do people drive each year? They’re typically used to show trends or compare different groups over time.
- Pie charts
Pie charts use slices of different-colored pie pieces to represent percentages. They’re often used to compare two or more discrete categories—for example, money spent on advertising vs. email marketing.
- Histograms
Histograms display the frequency of values in your data set by showing the number of occurrences at each point along an axis. It helps show the distribution of numerical data, like prices per item or the time gap between different events (like sales).
Other important types of data visualization
- Treemap
- Word Cloud
- Area Charts
- Bullet Graphs
- Gantt Charts
- Heat Maps
What you should look for in a Data Visualization Tool
Business intelligence tools are crucial in analyzing information and highlighting anomalies, including outliers. Here are some cool features that you should scout for:
- Ease of use: The tool should be very intuitive and easy to use for non-technical business users
- Agility: The tool should be agile so that any ad-hoc analysis is possible without dependency on a business intelligence developer or business analyst
- Easy to integrate: Data for business analysis is spread across different platforms in multiple formats. The tool should be capable of connecting with other platforms and databases for easy and fast data ingestion.
- Fast deployment: Generally, the schema for business analysis is complex and takes a lot of time to understand. The tool should be able to smartly understand domain datasets resulting in deployments in days and not months.
- Interactive dashboards: Through Data Visualization, you make your presentations and initiatives much more powerful, driving your message home in a way that directly benefits your organization. With interactive reports, you can tell a story with data, making your presentations to stakeholders more powerful. A good visualization tells a story, strips away noise from data, and highlights valuable insights.
- Visual elements: Using visual features such as charts, graphs, and maps, data visualization tools offer a convenient means of seeing and understanding trends, outliers, and patterns within data. Data visualization benefits the organization in decision-making, finding directions, finding outliers, tracking down actionable insights, and making decisions driven by data.
The goal of data visualization is to present data in such a way that it helps corporate leaders to get actionable insights at a glance without needing to explain it further or analyze it. Infogrames is a full-featured, drag-and-drop visualization tool extension that allows even non-designers to build compelling data visualizations for marketing reports, infographics, social media posts, maps, dashboards, and more.
How INSIA can help in Data Visualization
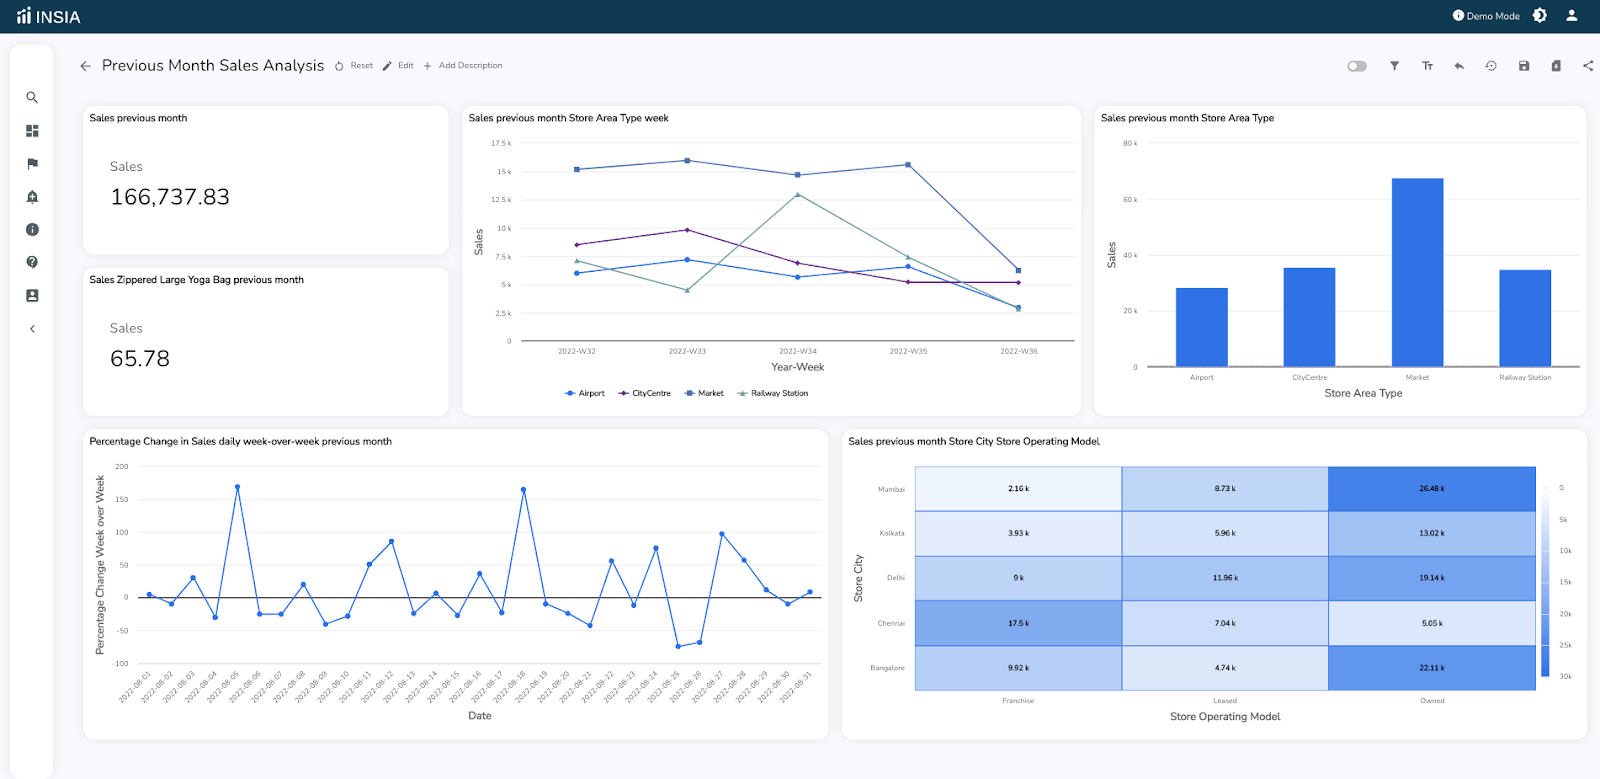
INSIA is more than a traditional tool for data visualization in business analytics. It is scalable and can handle all sorts of data. In addition, it offers complete end-to-end data integration with a host of critical features.
- It provides you with best-fit visualizations per industry standards with real-time updates.
- It offers more than 40 plus chart options.
- It gives you complete customization control to the user interface, where users can easily design dashboards how they want
- It customizes charts by changing axis names and lengths and the label names on each axis.
- It builds not only interactive dashboards but also allows you to select the type and value of all the filters possible for all the tables utilized to create charts available in the dashboard.


- It allows you to add your text or comments on the dashboard for every chart.

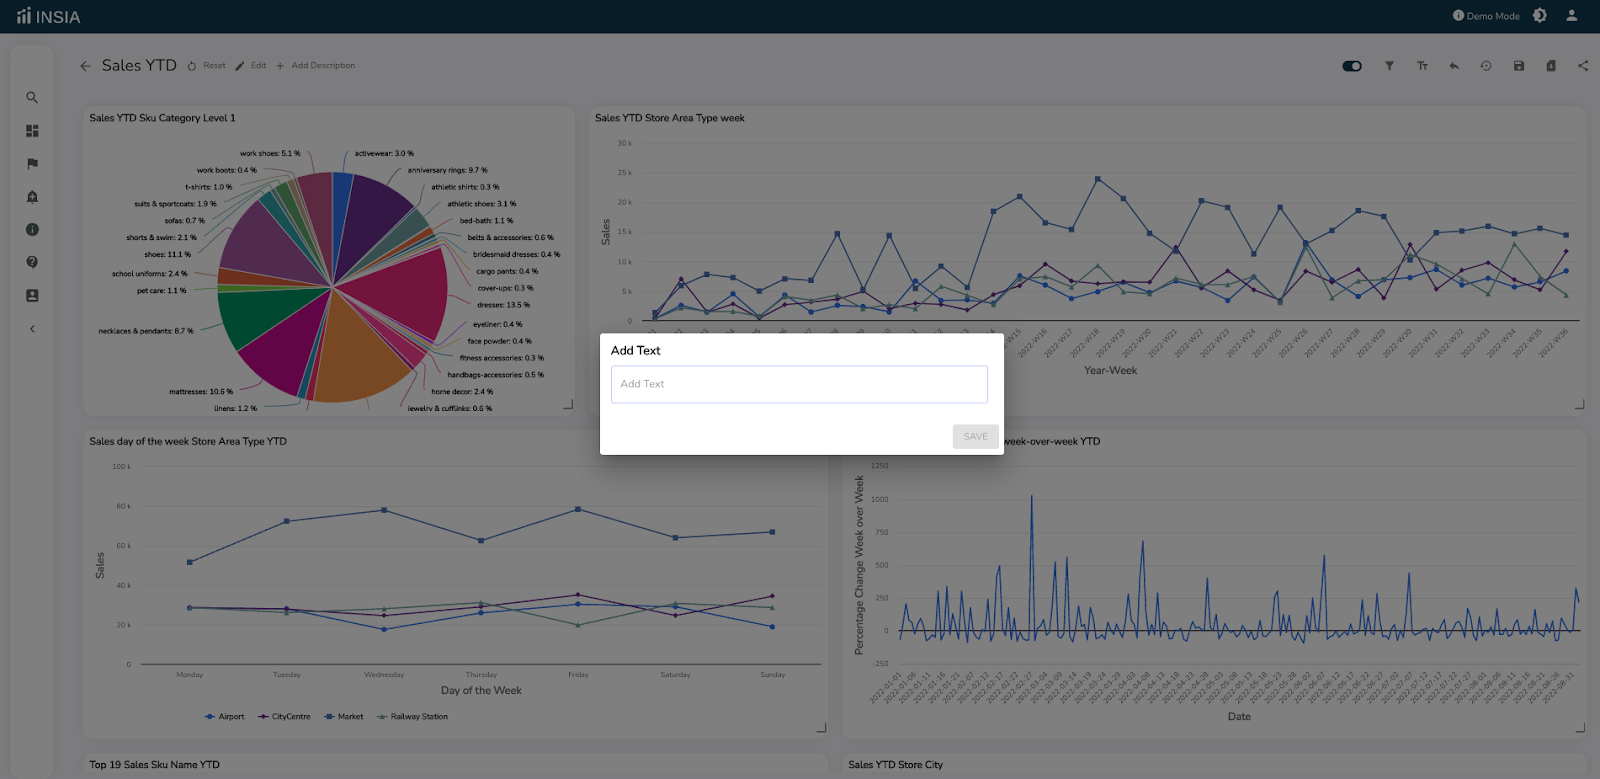
- It controls and restricts the data output on the charts and allows complete control over chart settings’ alignment and orientation arrangement.
- It allows you to reposition legends and, if needed, remove them at each chart label.
- It offers automatic schedule reporting and alerts with key optimization control features.
For increased team efficiency, better collaboration efforts, and easy sharing over various platforms, experience INSIA. Register for Free!
Conclusion
As customer preferences constantly change and evolve, selecting the right data visualization tool can be confusing. So instead, choose INSIA, an effective tool that helps create clear, interactive, and accurate data visualization solutions for businesses—interested in learning more about integrating your BI and analytics? Get a free trial today!