
Have you ever wondered how investors decide if a stock is “cheap” or “expensive”? One of the simplest yet most powerful tools is the price earnings ratio. Think of it as a quick thermometer for a stock’s valuation.
Suppose you’re buying a tiny slice of a company. Would you pay $20 for a slice that earns $2 a year, or $20 for a slice earning $5? The P/E ratio answers that question in one simple number.
What is the Price Earnings Ratio?
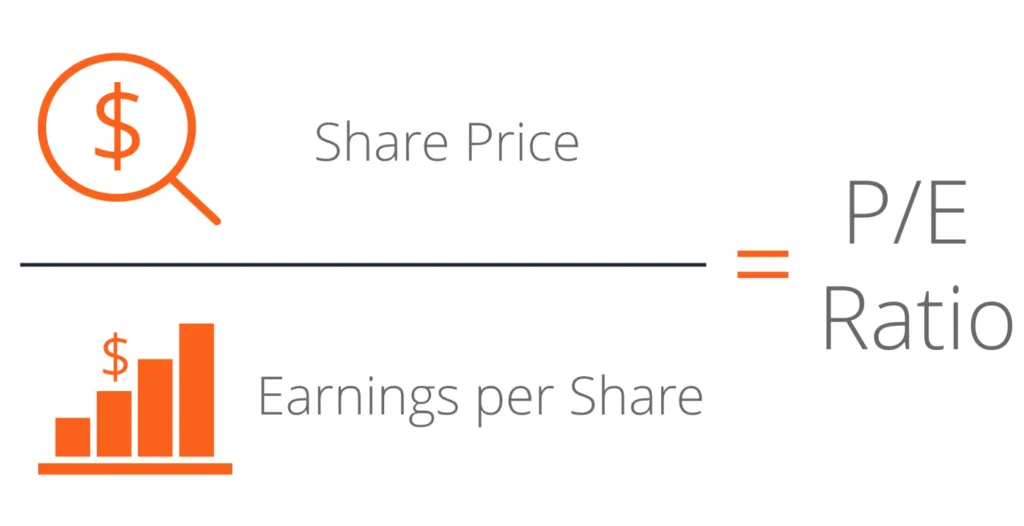
The price earnings ratio (P/E) shows how much investors are willing to pay for each $1 the company earns.
Formula:

Example:
| Stock Price | EPS | P/E Ratio |
| $45 | $3 | 15x |
| $100 | $5 | 20x |
Here, a P/E of 15x means it would take 15 years of current earnings to pay back your investment if you owned 100% of the company. Easy, right?
Different Types of P/E Ratios
There are three types of P/E ratios that are differentiated by the earnings data they use for calculation. It can be past, future or average earnings. Here are the insights into the same:
Trailing P/E – Uses actual earnings from the past 12 months. It’s based on real numbers but may not reflect future growth.
Example: EPS last year = $5, stock price = $100 → P/E = 20x
Forward P/E – Uses predicted earnings for the next year. This gives a forward-looking valuation.
Example: Expected EPS next year = $7, stock price = $100 → P/E = 14x
Blended P/E – Combines past and future earnings to give a balanced view. Early in the year, past earnings weigh more; later, projections weigh more.
Example: For March 2025, trailing P/E would carry more weight. In November 2025, forward P/E would gain more importance.
Why it matters: Different P/E types can give slightly different pictures. Knowing which one you’re looking at avoids confusion.
How P/E Ratio Links to Dividend Sustainability
A company’s ability to pay sustainable dividends depends on earnings growth.
-
- Low P/E Ratio may signal undervaluation. It could offer higher dividend returns only if the company is financially strong
-
- Moderate P/E Ratio (around 15) suggests stability. The company likely generates consistent earnings and can afford to pay steady dividends
-
- High P/E Ratio shows strong investor growth expectations. Profits often reinvested and dividend payouts may be smaller.
Pointer Table:
| P/E Level | Dividend Implication |
| Low (<10) | High yield possible, riskier |
| Moderate (10–20) | Safe and steady dividends |
| High (>25) | Growth-focused, dividends are smaller |
The Link Between P/E Ratio and Sustainable Dividend Growth
The Price-to-Earnings (P/E) ratio shows how much investors pay for each dollar a company earns. But if you care about dividends, P/E alone can’t tell you whether those payouts are sustainable or likely to grow.
Justified P/E Ratio
The Justified P/E adjusts the P/E for dividend payout and growth:

-
- R = Required rate of return
-
- G = Sustainable growth rate
A high justified P/E may indicate the stock is expensive relative to its dividend capacity.
PEGY Ratio: Growth + Yield
The PEGY ratio factors in earnings growth and dividend yield:

-
- PEGY < 1 → potentially undervalued
-
- Useful for spotting companies with both growth and steady dividends.
So, the key factors for dividend sustainability are:
-
- Earnings Stability – consistent profits support regular dividends
-
- Payout Ratio – lower ratio = room for growth and safety
-
- Cash Flow – ensures dividends can be paid even in downturns
Combine P/E with metrics like PEGY, payout ratio, and cash flow to find stocks that are fairly valued and likely to sustain dividends over time.
Using the PEG Ratio for Context
The PEG ratio adjusts the P/E ratio for earnings growth, helping investors see if a stock is truly undervalued.
Formula:

Example:
P/E = 15, expected growth = 20% → PEG = 0.75 → potentially undervalued
A PEG below 1 usually signals good value. For high-growth companies, PEG helps compare P/E in the context of expected growth.
Earnings Yield – Another Useful Metric
Earnings yield is the inverse of the P/E ratio, expressed as a percentage:

Example: P/E = 15 → Earnings Yield = 6.67%
Why it’s useful: It helps compare stocks with bonds or other fixed-income investments. A higher earnings yield often signals better return potential relative to price.
Valuation Guidelines for Different Growth Stocks
-
- Slow or Moderate Growth Stocks: P/E ~15 is often fair. Overpaying can make dividend sustainability tricky.
-
- High-Growth Stocks: A higher P/E is acceptable because earnings are expected to rise quickly.
-
- Tip: Use PEG to adjust for growth—paying slightly higher P/E may be reasonable if growth justifies it.
Quick Recap Table:
| Stock Type | Typical P/E | Dividend Outlook |
| Slow Growth | ~15 | Safe and steady |
| Moderate Growth | 15–20 | Growing gradually |
| Fast Growth | 20+ | Lower dividends, more reinvestment |
Limitations of the P/E Ratio
While helpful, the price earnings ratio isn’t perfect:
-
- Doesn’t account for debt levels or cash flow.
-
- Can be misleading for companies with negative earnings.
-
- Past earnings (trailing P/E) don’t guarantee future performance.
Practical Tips for Investors
-
- Compare P/E with peers and the industry
-
- Look at trends in earnings and dividends to check if a rising P/E is supported by growing earnings or caused due to falling profits
-
- For dividend investors, a reasonable P/E + steady growth = safer income: Note it to evaluate whether to expect consistent returns while minimising unnecessary risk
-
- Avoid chasing low P/E without checking fundamentals: To avoid companies that appear cheap but may be in financial trouble
Conclusion
The price earnings ratio is a strong starting point for understanding stock valuation. It also helps with dividend potential. It tells what you’re paying for earnings, but it’s not a crystal ball. Pair it with growth metrics, dividend sustainability, and other financial indicators for smarter investing decisions.