
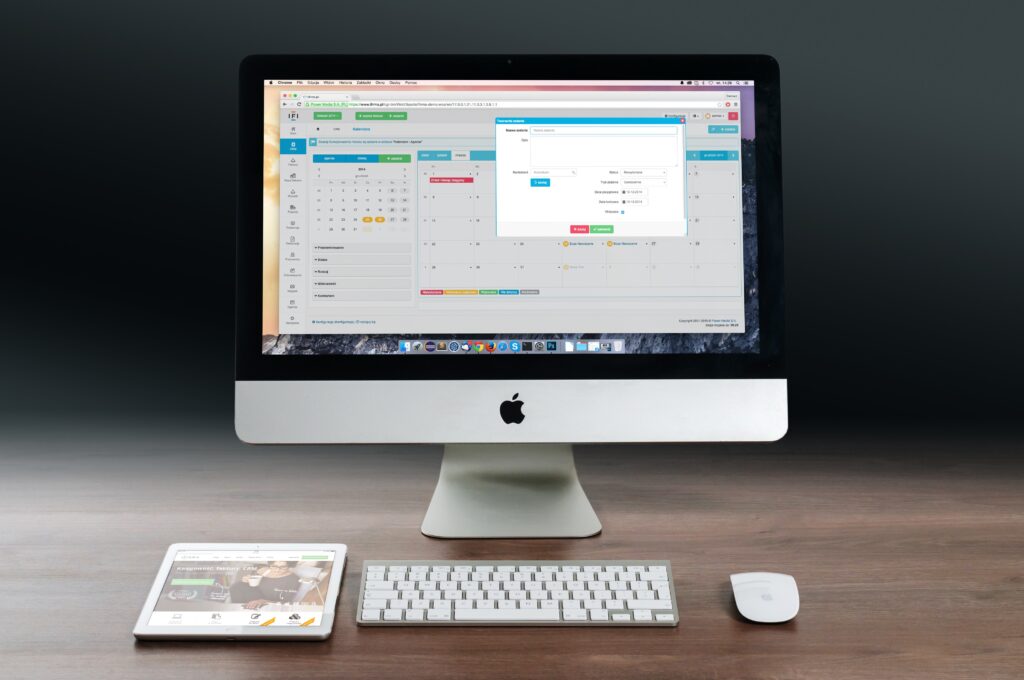
A dashboard is an indispensable tool for managing marketing and making business decisions based on data analytics. However, in order for them to be convenient to use and not take a lot of time to work, it is important to find the right service that suits a particular business or project in terms of functionality, visualization capabilities, available data sources, and budget.
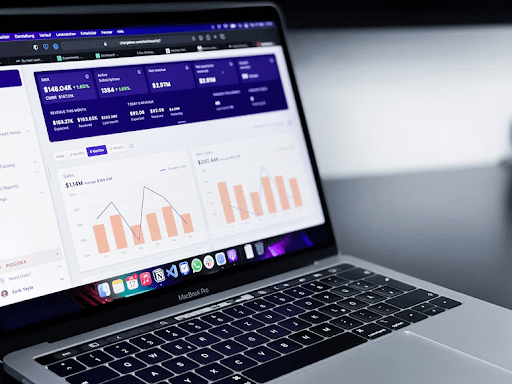
We reviewed 5 popular programs with features, advantages, and disadvantages. Read, choose and create the perfect dashboards for yourself and your clients. As a last resort, you can always contact a dashboard design agency.
Google Data Studio
Data analysis and visualization service from Google. One of the most popular tools for creating interactive dashboards in marketing and beyond. Marketers are attracted by free, 490+ connectors for connecting data sources, wide customization, and visualization options.
Pros:
- wide possibilities of data visualization: 14 graphs in different variations + visualizations from third-party developers;
- shared access with differentiation of rights;
- calculation of user indicators based on existing metrics;
- combining data from different sources on one dashboard and chart;
- version history;
- wide customization options – you can create a completely unique branded dashboard;
- access is completely free.
Cons:
- does not work offline;
- not adapted for smartphones and tablets;
- dashboards with a lot of data can put a lot of stress on your computer.
Microsoft Power BI
One of the most famous business intelligence and data visualization systems. Allows you to connect to multiple sources and create reports and interactive dashboards based on them.
The interface is reminiscent of other Microsoft products, especially Excel. The dashboard editor works on the principle of drag-and-drop – all visualization elements and data are added to the panel by simple drag and drop. Despite the simple interface and affordable prices, it is focused more on medium and large businesses than on small ones.
Pros:
- simple interface;
- mobile, desktop, and web version;
- there is a free plan;
- seamless integration with Microsoft products;
- hundreds of data visualization elements: bar charts, Gantt chart, arrow indicator, heat maps, sparklines, etc.
Cons:
- does not work on MacOS;
- no phone support;
- can slow down when importing and processing large amounts of data.
Tableau
Another BI system is designed for data analysis and visualization. The interface is designed to be easy to understand even if you have never created dashboards before. Allows you to create interactive and real-time updated panels, including those based on combined data.
Pros:
- supports more than 30 data types;
- one of the easiest business intelligence tools to learn;
- a lot of educational information in text and video format;
- developed and updated regularly.
Cons:
- narrowly focused functionality – for example, other tools are needed to visualize financial reports;
- before loading, the data needs to be processed and structured;
- developer assistance may be required to implement the Tableau Server version.
Klipfolio
A platform for data import, analysis, and visualization. Positioned as a powerful yet easy-to-use and affordable business intelligence tool. Its interface is intuitive, and working in the cloud allows you to quickly process and visualize data, reflecting changes in real-time.
Dashboards are assembled through a visual WYSIWYG editor. Knowing HTML and CSS, you can create your own unique visualization elements. It is possible to calculate custom indicators, including those based on initial metrics from various sources.
Klipfolio:
- intuitive interface;
- loading data from online and offline sources;
- you can connect any data source via the REST API;
- compatible with smartphones, tablets, SmartTV, and other devices;
- there is a differentiation of access rights;
- develops, new options and functions appear;
- ample opportunities for customizing dashboards, including using HTML and CSS.
Cons:
- it will take time to master the tool;
- for custom styles you will have to pay separately;
- complex formulas for calculating indicators.
Geckoboard
A tool for collecting, analyzing, and visualizing data, focused on solving business problems. Dashboards in the constructor are assembled from separate widgets that display data from a particular source. If the required service is not among the ready-made integrations, you can upload your own data via API, spreadsheets and databases. Data from sources with which there is no built-in integration is also imported through Zapier.
Pros:
- built-in integration with 60+ data sources;
- the ability to set goals to track the achievement of KPI;
- many visualization options;
- the ability to customize dashboards using CSS;
- simple interface.
Cons:
- there are few sources useful on the Russian market in the catalog of built-in integrations;
- no data loading from CSV and XLS files;
- on the free plan, you can create dashboards based on data from spreadsheets only.

Conclusion
The ideal analytical dashboard is not only informative and functional but also does not require a lot of time to create and work. We hope our article will help you choose the right dashboard builder for your project.