

An Instagram engagement rate of 211.20% sounds impossible. Yet that’s the result I got when testing a calculator with 1,000 likes, 56 comments, and 500 followers. The math was correct, but what does that number actually tell a brand?
As a marketing specialist, I use the Instagram engagement rate formula to compare content performance and spot meaningful patterns. Here’s how I calculate and interpret the results, using Engagement Rate Calculator to check the numbers.
What Engagement Rate Measures
Engagement rate compares the interactions generated by content with a selected audience or exposure metric. Likes and comments are useful for public-profile analysis. For accounts with authorized Instagram Insights access, saves, shares, reach, and other performance figures may also be available. The denominator determines what the percentage actually measures.
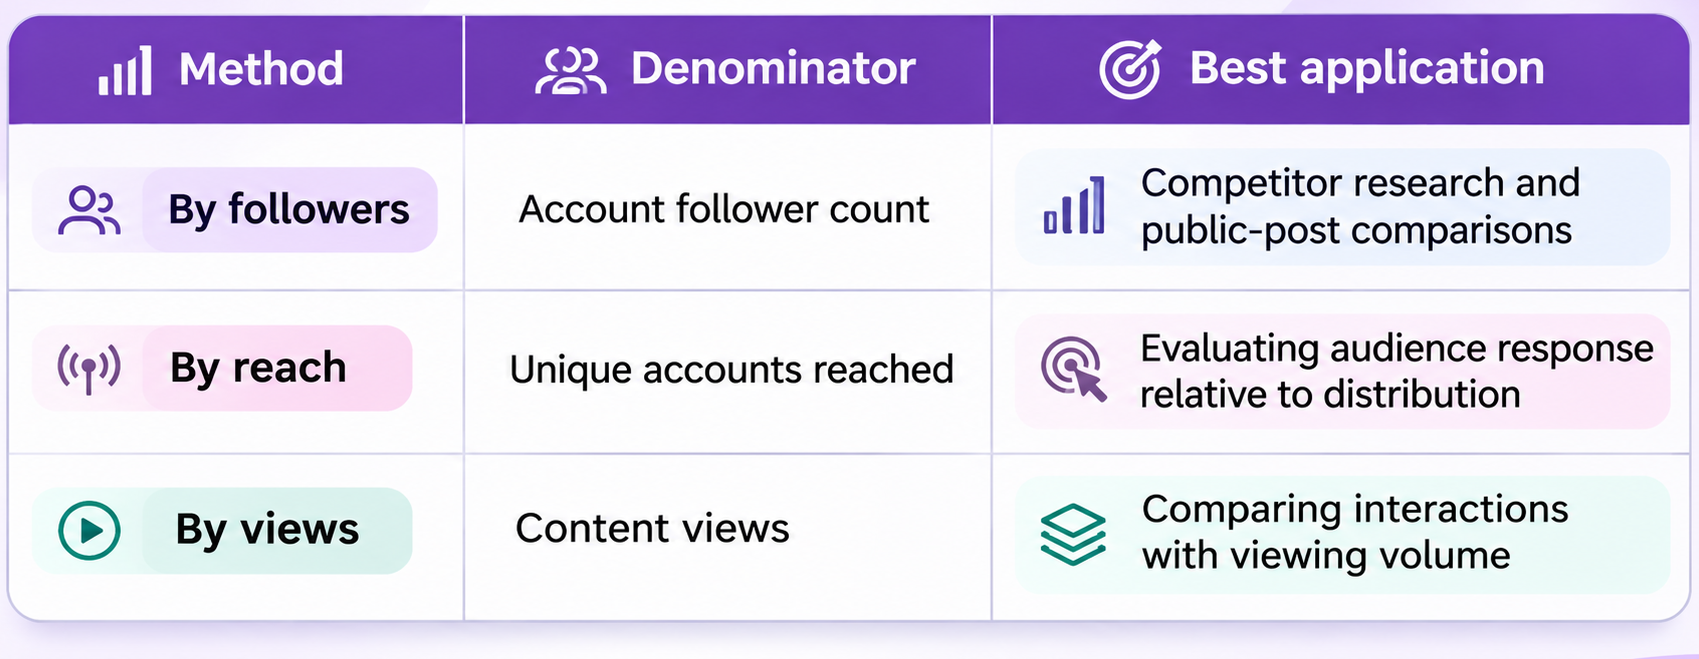
A brand with 20,000 followers may reach only 5,000 accounts with a particular post. The follower-based formula uses the full follower count, while the reach-based formula uses the number of accounts that saw the content.
In my reports, I keep these metrics separate to avoid misleading comparisons.
Formula by Followers
To calculate Instagram engagement rate by followers, add a post’s likes and comments, divide the total by the account’s follower count, and multiply by 100. This method works well for analyzing public Instagram accounts.
Engagement rate (%) = (Likes + Comments) ÷ Followers × 100
Example 1: Engagement Rate of 211.20%
I tested the calculator with these sample values:
- Likes: 1,000
- Comments: 56
- Followers: 500
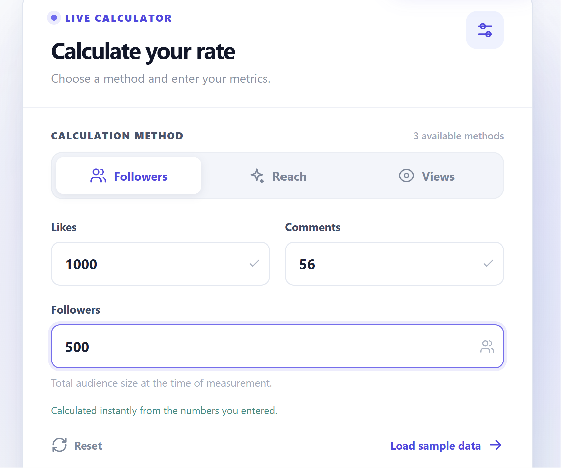
The calculation has two steps:
1,000 + 56 = 1,056 interactions
(1,056 ÷ 500) × 100 = 211.20%
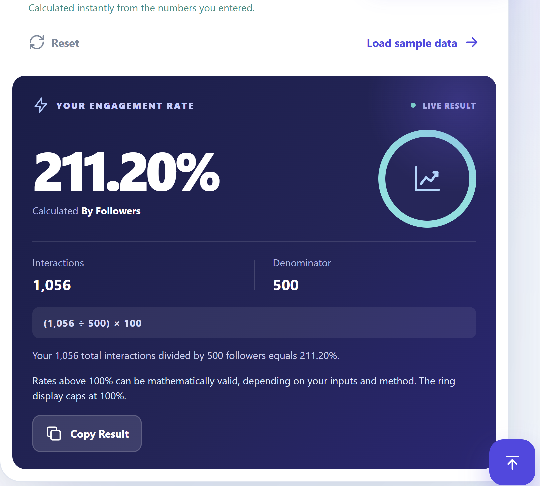
A rate above 100% is possible because nonfollowers can interact with public posts. One person can also contribute both a like and a comment.
For a brand, I’d check whether this was an exceptional post or part of a consistent performance pattern.
Example 2: Engagement Rate of 3%
A post receives 420 likes and 30 comments from an account with 15,000 followers.
(420 + 30) ÷ 15,000 × 100 = 3.00%
When comparing brands, I calculate engagement across several posts from the same 30-day period rather than judging performance from one result. This helps identify typical performance and unusually successful content.
Formula by Reach
Reach shows how many unique Instagram accounts saw a post. Unlike likes, comments, and follower counts, reach is available through Instagram Insights to authorized account users, not publicly visible on other profiles.
Engagement rate by reach (%) = (Likes + Comments) ÷ Accounts Reached × 100
Example: Engagement Rate of 7.50%
Using the previous post’s 420 likes and 30 comments, let’s calculate engagement based on its reach of 6,000 accounts.
420 + 30 = 450 interactions
(450 ÷ 6,000) × 100 = 7.50%
The same post has a 3.00% follower-based rate and a 7.50% reach-based rate. The difference comes from the denominator.
When I Use This Formula
For brands I work with, I use reach-based engagement when they provide access to Instagram Insights. If saves and shares are included, I adjust the formula and document which interactions were counted. For competitor research, I use follower-based engagement because another account’s reach isn’t publicly available. I never estimate it from likes or follower counts.
Average Post Versus Aggregate
When analyzing several Instagram posts, I use two methods to summarize engagement. The difference is how much weight each post receives.
| Comparison | Average Post Engagement | Aggregate Engagement |
|---|---|---|
| Formula | Sum of post engagement rates ÷ Number of posts | Total interactions ÷ Sum of post-level denominators × 100 |
| Weight | Every post counts equally | Posts with larger denominators carry more weight |
| Best for | Comparing typical post performance | Measuring combined engagement across posts |
Which method should you use?
For monthly brand reports, I generally start with average post engagement. It helps me compare content performance across reporting periods. I use aggregate engagement when I want a denominator-weighted result, especially if the account’s follower count changed during the period.
Sample Calculation Table
Here’s how I’d compare engagement rates across three posts as a brand’s follower count grows.

Step 1: Calculate Each Post’s Engagement Rate
Formula: (Likes + Comments) ÷ Followers × 100
- Post A: (180 + 20) ÷ 10,000 × 100 = 2.00%
- Post B: (240 + 60) ÷ 12,000 × 100 = 2.50%
- Post C: (135 + 15) ÷ 15,000 × 100 = 1.00%
Step 2: Calculate Average and Aggregate Engagement
| Method | Calculation | Result |
|---|---|---|
| Average ER | (2.00% + 2.50% + 1.00%) ÷ 3 | 1.83% |
| Aggregate ER | (200 + 300 + 150) ÷ (10,000 + 12,000 + 15,000) × 100 | 1.76% |
The average treats all three posts equally. The aggregate weights them by their follower-count denominators.
Step 3: Interpret the Results
Post B has the highest engagement rate at 2.50%. Post C has the most followers but the lowest rate at 1.00%. I’d compare the posts’ topics, formats, and comments to understand why the later post attracted fewer interactions. Over the next 30 days, I’d test two promising content themes and compare their results with the 1.83% average and 2.00% median from this sample.
Frequent Calculation Mistakes
Even with the right formula, small mistakes can affect engagement rates. Here are five common issues I watch for when analyzing Instagram performance.
1. Missing Interactions
Some calculations include only likes and comments, while others also count saves and shares. Both approaches can work, but mixing them makes comparisons unreliable. I use the same set of metrics for every post.
2. Mismatched Measurement Periods
A post published two days ago has had less time to collect interactions than one published three weeks ago. I compare posts measured over similar periods to get a fairer picture of performance.
3. Incorrect Follower Counts
An account may have 10,000 followers when a post is published and 15,000 a few months later. Using the newer figure would lower the calculated rate. I use follower counts from the relevant period whenever possible.
4. Different Denominators
A rate calculated using followers isn’t directly comparable to one calculated using reach. The percentages measure different things, so I keep them separate in brand reports.
5. Ignoring Business Goals
A funny Reel might receive hundreds of comments, while a product post generates fewer interactions but brings in more customers. As Meta’s Insights guidance explains, the metrics you track should reflect your business goals. I also check website traffic, leads, and sales when evaluating content performance.
When a Calculator Helps
An engagement rate calculator helps me check the figures before adding them to a brand report. I enter the post’s likes and comments, choose Followers, Reach, or Views, and provide the corresponding number. The tool shows the percentage and calculation.
The results depend on the data I enter. The tool doesn’t retrieve Instagram metrics automatically or access private Insights. I still check the source of each figure and the measurement period before comparing posts.
Check Your Instagram Engagement
Enter your post’s likes, comments, and audience figures into Engagement Rate Calculator to get an instant percentage with a clear breakdown of the calculation.
Calculate Your Engagement Rate
From Engagement Rates to Marketing Decisions
I wouldn’t recommend changing a brand’s content strategy because one post achieved a high engagement rate. I’d compare at least a few weeks of posts, examine which topics repeatedly generate responses, and identify what to test next.
For a useful monthly report, I’d include the average and median engagement rates, the strongest and weakest posts, and two or three specific recommendations for the next reporting period.